CarMax 2000 Annual Report Download - page 79
Download and view the complete annual report
Please find page 79 of the 2000 CarMax annual report below. You can navigate through the pages in the report by either clicking on the pages listed below, or by using the keyword search tool below to find specific information within the annual report.-
 1
1 -
2
-
3
-
4
-
5
-
6
-
7
-
8
-
9
-
10
-
11
-
12
-
13
-
14
-
15
-
16
-
17
-
18
-
19
-
20
-
21
-
22
-
23
-
24
-
25
-
26
-
27
-
28
-
29
-
30
-
31
-
32
-
33
-
34
-
35
-
36
-
37
-
38
-
39
-
40
-
41
-
42
-
43
-
44
-
45
-
46
-
47
-
48
-
49
-
50
-
51
-
52
-
53
-
54
-
55
-
56
-
57
-
58
-
59
-
60
-
61
-
62
-
63
-
64
-
65
-
66
-
67
-
68
-
 69
69 -
 70
70 -
 71
71 -
 72
72 -
 73
73 -
 74
74 -
 75
75 -
 76
76 -
 77
77 -
 78
78 -
 79
79 -
 80
80 -
 81
81 -
 82
82 -
 83
83 -
 84
84 -
 85
85 -
 86
86
 |
 |

CIRCUIT CITY STORES, INC. 2000 ANNUAL REPORT 77
CARMAX GROUP
key employees are granted restricted shares of CarMax Group Stock.
Shares are awarded in the name of the employee,who has all the rights of
a shareholder, subject to certain restrictions or forfeitures. Restrictions on
the awards generally expire five years from the date of grant. In fiscal
2000,restricted stock awards for 30,000 shares were granted to eligible
employees. The market value at the date of grant of these shares has been
recorded as unearned compensation and is a component of Group equity.
Unearned compensation is expensed over the restriction periods. In fiscal
2000,a total of $447,200 was charged to CarMax Group operations
($426,600 in fiscal 1999 and $77,700 in fiscal 1998). As of February 29,
2000,110,833 restricted shares were outstanding.
(E) EMPLOYEE STOCK PURCHASE PLAN: The Company has Employee Stock
Purchase Plans for all employees meeting certain eligibility criteria. The
CarMax Group Plan allows eligible employees to purchase shares of
CarMax Group Stock,subject to certain limitations. For each $1.00
contributed by employees under the Plan,the Company matches $0.15.
Purchases are limited to 10 percent of an employee’s eligible compensa-
tion,up to a maximum of $7,500 per year. At February 29, 2000, a total of
1,058,693 shares remained available under the CarMax Group Plan. Dur-
ing fiscal 2000,580,000 shares were issued to or purchased on the open
market on behalf of the employees (268,532 in fiscal 1999 and 92,775 in
fiscal 1998). The average price per share purchased under the Plan was
$3.68 in fiscal 2000, $7.56 in fiscal 1999 and $12.73 in fiscal 1998. The
Company match or purchase price discount charged to CarMax Group
operations totaled $221,500 in fiscal 2000,$268,100 in fiscal 1999 and
$160,900 in fiscal 1998.
(F) STOCK INCENTIVE PLANS: Under the Company’s stock incentive plans,
incentive and nonqualified stock options may be granted to management,
key employees and outside directors to purchase shares of CarMax Group
Stock. The exercise price for nonqualified options granted under the 1994
plan is equal to,or greater than,the market value at the date of grant.
Options generally are exercisable over various periods ranging from one
to seven years from the date of grant.
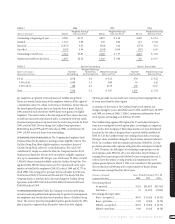
A summary of the status of the CarMax Group’s stock options and
changes during the years ended February 29,2000,and February 28, 1999
and 1998,are shown in Table 1. Table 2 summarizes information about
stock options outstanding as of February 29,2000.
The CarMax Group applies APB Opinion No.25 and related interpreta-
tions in accounting for its stock option plans. Accordingly,no compensa-
tion cost has been recognized. Had compensation cost been determined
based on the fair value at the grant date consistent with the methods of
SFAS No.123,the CarMax Group’s net earnings (loss) and net earnings
(loss) per share would have changed to the pro forma amounts indicated
below. In accordance with the transition provisions of SFAS No.123,the
pro forma amounts reflect options with grant dates subsequent to March
1,1995.Therefore, the full impact of calculating compensation cost for
stock options under SFAS No.123 is not reflected in the pro forma net
earnings (loss) amounts presented below because compensation cost is
reflected over the options’ vesting periods and compensation cost of
options granted prior to March 1,1995,is not considered. The pro forma
effect on fiscal year 2000 may not be representative of the pro forma
effects on net earnings (loss) for future years.
(Amounts in thousands Years Ended February 29 or 28
except per share data) 2000 1999 1998
Net earnings (loss):
As reported ............................................ $ 256 $(5,457) $(7,763)
Pro forma............................................... 75 (5,537) (7,824)
Net earnings (loss) per share:
Basic
—
as reported................................. $0.01 $ (0.24) $ (0.35)
Basic
—
pro forma ................................... 0.00 (0.24) (0.36)
Diluted
—
as reported.............................. $0.01 $ (0.24) $ (0.35)
Diluted
—
pro forma................................ 0.00 (0.24) (0.36)
TABLE 1 2000 1999 1998
Weighted Average Weighted Average Weighted Average
(Shares in thousands) Shares Exercise Price Shares Exercise Price Shares Exercise Price
Outstanding at beginning of year.................. 4,380 $1.77 4,822 $ 1.49 4,769 $ 0.51
Granted.......................................................... 1,132 5.89 205 8.63 413 13.04
Exercised........................................................ (2,027) 0.22 (543) 0.22 (273) 0.22
Cancelled ....................................................... (161) 6.94 (104) 10.54 (87) 6.36
Outstanding at end of year ............................ 3,324 $3.87 4,380 $ 1.77 4,822 $ 1.49
Options exercisable at end of year ................. 1,203 $2.54 1,566 $ 0.96 762 $ 0.37
TABLE 2 Options Outstanding Options Exercisable
Weighted Average
(Shares in thousands) Number Remaining Weighted Average Number Weighted Average
Range of Exercise Prices Outstanding Contractual Life Exercise Price Exercisable Exercise Price
$ 0.22 ........................................................................... 1,638 2.0 $ 0.22 934 $ 0.22
3.90 to 6.06................................................................ 1,098 5.3 5.89 19 4.25
6.25 to 16.31.............................................................. 588 4.0 10.29 250 11.07
Total ............................................................................. 3,324 3.4 $ 3.87 1,203 $ 2.54