CarMax 2000 Annual Report Download - page 3
Download and view the complete annual report
Please find page 3 of the 2000 CarMax annual report below. You can navigate through the pages in the report by either clicking on the pages listed below, or by using the keyword search tool below to find specific information within the annual report.-
 1
1 -
 2
2 -
 3
3 -
 4
4 -
 5
5 -
 6
6 -
 7
7 -
 8
8 -
 9
9 -
 10
10 -
 11
11 -
 12
12 -
 13
13 -
 14
14 -
15
-
16
-
17
-
18
-
19
-
20
-
21
-
22
-
23
-
24
-
25
-
26
-
27
-
28
-
29
-
30
-
31
-
32
-
33
-
34
-
35
-
36
-
37
-
38
-
39
-
40
-
41
-
42
-
43
-
44
-
45
-
46
-
47
-
48
-
49
-
50
-
51
-
52
-
53
-
54
-
55
-
56
-
57
-
58
-
59
-
60
-
61
-
62
-
63
-
64
-
65
-
66
-
67
-
68
-
69
-
70
-
71
-
72
-
73
-
74
-
75
-
76
-
77
-
78
-
79
-
80
-
81
-
82
-
83
-
84
-
85
-
86
 |
 |

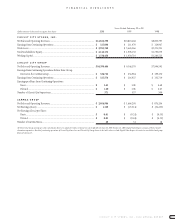
FINANCIAL HIGHLIGHTS
CIRCUIT CITY STORES, INC. 2000 ANNUAL REPORT 1
Years Ended February 29 or 28
(Dollar amounts in thousands except per share data) 2000 1999 1998
CIRCUIT CITY STORES, INC.
Net Sales and Operating Revenues.......................................................................... $12,614,390 $10,810,468 $8,870,797
Earnings from Continuing Operations.................................................................... $ 327,830 $ 211,470 $ 124,947
Total Assets.............................................................................................................. $ 3,955,348 $ 3,445,266 $3,231,701
Total Stockholders’ Equity........................................................................................ $ 2,142,174 $ 1,905,130 $1,730,039
Working Capital....................................................................................................... $ 1,536,456 $ 1,430,710 $1,240,523
CIRCUIT CITY GROUP
Net Sales and Operating Revenues.......................................................................... $10,599,406 $ 9,344,170 $7,996,591
Earnings from Continuing Operations Before Inter-Group
Interest in the CarMax Group............................................................................. $ 326,712 $ 234,984 $ 159,170
Earnings from Continuing Operations.................................................................... $ 327,574 $ 216,927 $ 132,710
Earnings per Share from Continuing Operations:
Basic................................................................................................................... $ 1.63 $ 1.09 $ 0.68
Diluted................................................................................................................ $ 1.60 $ 1.08 $ 0.67
Number of Circuit City Superstores......................................................................... 571 537 500
CARMAX GROUP
Net Sales and Operating Revenues........................................................................... $ 2,014,984 $ 1,466,298 $ 874,206
Net Earnings (Loss)................................................................................................. $ 1,118 $ (23,514) $ (34,223)
Net Earnings (Loss) per Share:
Basic................................................................................................................... $ 0.01 $ (0.24) $ (0.35)
Diluted................................................................................................................ $ 0.01 $ (0.24) $ (0.35)
Number of CarMax Stores........................................................................................ 40 31 18
All Circuit City Group earnings per share calculations have been adjusted to reflect a two-for-one stock split effective June 30,1999. On June 16, 1999, Digital Video Express announced that it would
discontinue operations. Results of continuing operations of Circuit City Stores,Inc. and Circuit City Group shown in the tables above exclude Digital Video Express. See notes to consolidated and group
financial statements.