Audi 2009 Annual Report Download - page 234
Download and view the complete annual report
Please find page 234 of the 2009 Audi annual report below. You can navigate through the pages in the report by either clicking on the pages listed below, or by using the keyword search tool below to find specific information within the annual report.-
 1
1 -
2
-
3
-
4
-
5
-
6
-
7
-
8
-
9
-
10
-
11
-
12
-
13
-
14
-
15
-
16
-
17
-
18
-
19
-
20
-
21
-
22
-
23
-
24
-
25
-
26
-
27
-
28
-
29
-
30
-
31
-
32
-
33
-
34
-
35
-
36
-
37
-
38
-
39
-
40
-
41
-
42
-
43
-
44
-
45
-
46
-
47
-
48
-
49
-
50
-
51
-
52
-
53
-
54
-
55
-
56
-
57
-
58
-
59
-
60
-
61
-
62
-
63
-
64
-
65
-
66
-
67
-
68
-
69
-
70
-
71
-
72
-
73
-
74
-
75
-
76
-
77
-
78
-
79
-
80
-
81
-
82
-
83
-
84
-
85
-
86
-
87
-
88
-
89
-
90
-
91
-
92
-
93
-
94
-
95
-
96
-
97
-
98
-
99
-
100
-
101
-
102
-
103
-
104
-
105
-
106
-
107
-
108
-
109
-
110
-
111
-
112
-
113
-
114
-
115
-
116
-
117
-
118
-
119
-
120
-
121
-
122
-
123
-
124
-
125
-
126
-
127
-
128
-
129
-
130
-
131
-
132
-
133
-
134
-
135
-
136
-
137
-
138
-
139
-
140
-
141
-
142
-
143
-
144
-
145
-
146
-
147
-
148
-
149
-
150
-
151
-
152
-
153
-
154
-
155
-
156
-
157
-
158
-
159
-
160
-
161
-
162
-
163
-
164
-
165
-
166
-
167
-
168
-
169
-
170
-
171
-
172
-
173
-
174
-
175
-
176
-
177
-
178
-
179
-
180
-
181
-
182
-
183
-
184
-
185
-
186
-
187
-
188
-
189
-
190
-
191
-
192
-
193
-
194
-
195
-
196
-
197
-
198
-
199
-
200
-
201
-
202
-
203
-
204
-
205
-
206
-
207
-
208
-
209
-
210
-
211
-
212
-
213
-
214
-
215
-
216
-
217
-
218
-
219
-
220
-
221
-
222
-
223
-
 224
224 -
 225
225 -
 226
226 -
 227
227 -
 228
228 -
 229
229 -
 230
230 -
 231
231 -
 232
232 -
 233
233 -
 234
234 -
 235
235 -
 236
236 -
 237
237 -
 238
238 -
 239
239 -
 240
240 -
 241
241 -
 242
242 -
 243
243 -
 244
244 -
245
-
246
-
247
-
248
-
249
-
250
-
251
-
252
 |
 |
231
Consolidated Financial
Statements
178 Income Statement
179 Statement of Recognized
Income and Expense
180 Balance Sheet
181 Cash Flow Statement
182 Statement of Changes in Equity
Notes to the Consolidated
Financial Statements
184 Development of fixed assets
in the 2009 fiscal year
186 Development of fixed assets
in the 2008 fiscal year
188 General information
192 Recognition and
measurement principles
199 Notes to the Income Statement
205 Notes to the Balance Sheet
215 Additional disclosures
236 Events occurring subsequent
to the balance sheet date
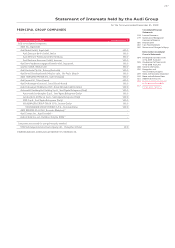
237 Statement of Interests
held by the Audi Group
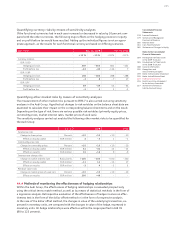
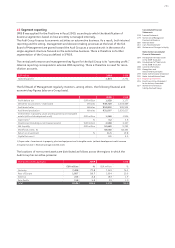
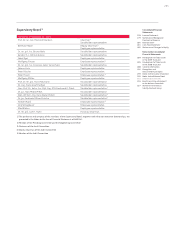
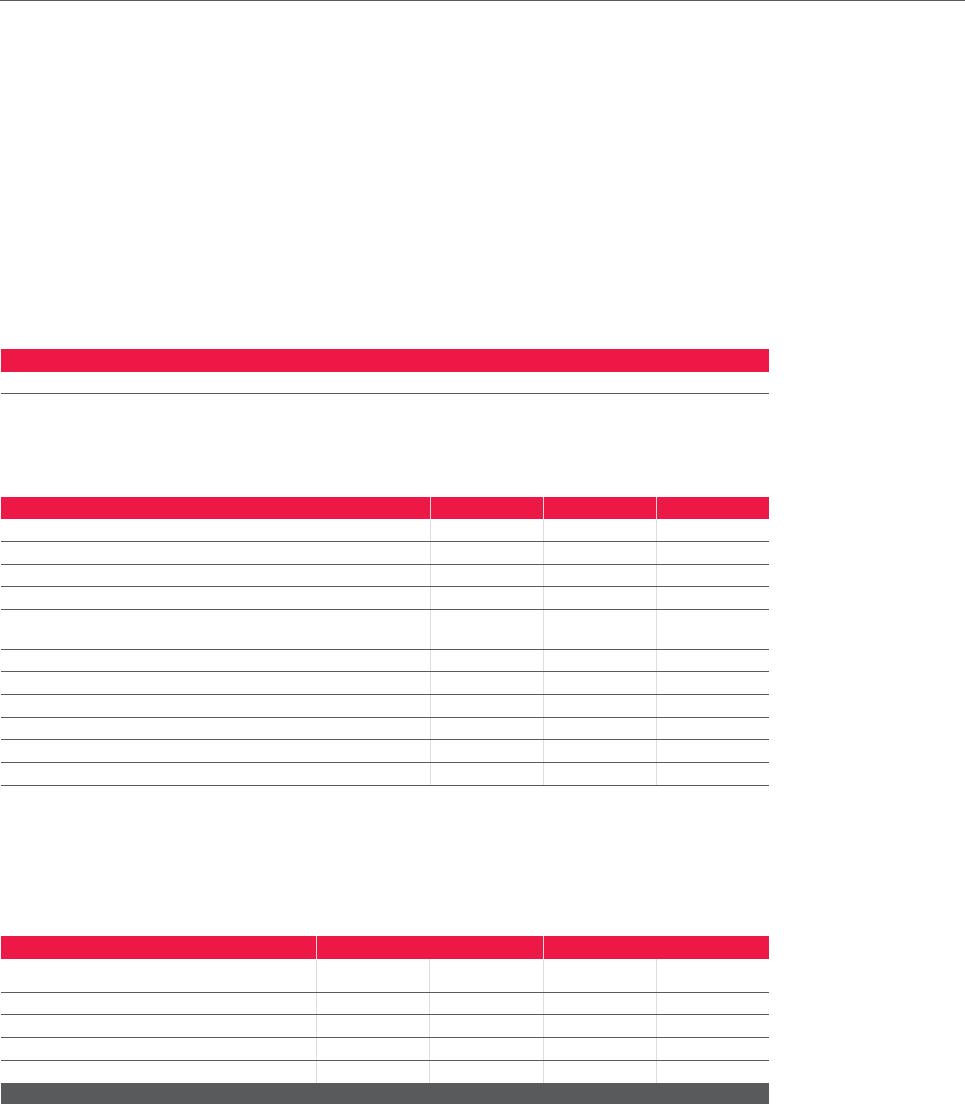
46 Segment reporting
IFRS 8 was applied for the first time in fiscal 2009, according to which the identification of
business segments is based on how an entity is managed internally.
The Audi Group focuses its economic activities on automotive business. As a result, both internal
reporting and the voting, management and decision-making processes at the level of the full
Board of Management are geared toward the Audi Group as a corporate unit in the sense of a
single-segment structure focused on the automotive business. There is therefore no further
segmentation of the Group as defined in IFRS 8.
The central performance and management key figure for the Audi Group is its “operating profit.”
Internal reporting corresponds to external IFRS reporting. There is therefore no need for recon-
ciliation accounts.
EUR million 2009 2008
Operating profit 1,604 2,772
The full Board of Management regularly monitors, among others, the following financial and
economic key figures (also on a Group basis).
2009 2008
Profit before tax EUR million 1,928 3,177
Deliveries to customers – Audi brand Vehicles 949,729 1,003,469
Audi brand sales Vehicles 954,802 999,503
Audi brand production Vehicles 931,007 1,026,617
Investments in property, plant and equipment and intangible
assets (without development work) EUR million 1,266 1,906
Capex ratio 1) % 4.2 5.6
Inventories (including current leased assets) EUR million 2,568 3,347
Net liquidity EUR million 10,665 9,292
Workforce at Dec. 31 58,046 58,335
Return on investment %11.5 19.8
Capital turnover 2) 3.1 3.5
1) Capex ratio = Investments in property, plant and equipment and intangible assets (without development work)/revenue
2) Capital turnover = Revenue/average invested assets
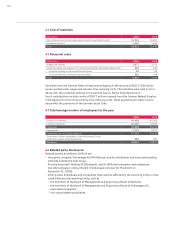
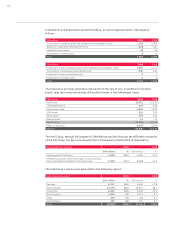
The locations of non-current assets are distributed as follows across the regions in which the
Audi Group has an active presence:
Non-current assets by region 2009 2008
EUR million %EUR million %
Germany 7,498 77.8 7,265 76.2
Rest of Europe 1,807 18.7 1,994 20.9
America 214 2.2 183 1.9
Asia-Pacific 118 1.2 95 1.0
Total 9,636 100.0 9,538 100.0