Audi 2009 Annual Report Download - page 158
Download and view the complete annual report
Please find page 158 of the 2009 Audi annual report below. You can navigate through the pages in the report by either clicking on the pages listed below, or by using the keyword search tool below to find specific information within the annual report.-
 1
1 -
2
-
3
-
4
-
5
-
6
-
7
-
8
-
9
-
10
-
11
-
12
-
13
-
14
-
15
-
16
-
17
-
18
-
19
-
20
-
21
-
22
-
23
-
24
-
25
-
26
-
27
-
28
-
29
-
30
-
31
-
32
-
33
-
34
-
35
-
36
-
37
-
38
-
39
-
40
-
41
-
42
-
43
-
44
-
45
-
46
-
47
-
48
-
49
-
50
-
51
-
52
-
53
-
54
-
55
-
56
-
57
-
58
-
59
-
60
-
61
-
62
-
63
-
64
-
65
-
66
-
67
-
68
-
69
-
70
-
71
-
72
-
73
-
74
-
75
-
76
-
77
-
78
-
79
-
80
-
81
-
82
-
83
-
84
-
85
-
86
-
87
-
88
-
89
-
90
-
91
-
92
-
93
-
94
-
95
-
96
-
97
-
98
-
99
-
100
-
101
-
102
-
103
-
104
-
105
-
106
-
107
-
108
-
109
-
110
-
111
-
112
-
113
-
114
-
115
-
116
-
117
-
118
-
119
-
120
-
121
-
122
-
123
-
124
-
125
-
126
-
127
-
128
-
129
-
130
-
131
-
132
-
133
-
134
-
135
-
136
-
137
-
138
-
139
-
140
-
141
-
142
-
143
-
144
-
145
-
146
-
147
-
 148
148 -
 149
149 -
 150
150 -
 151
151 -
 152
152 -
 153
153 -
 154
154 -
 155
155 -
 156
156 -
 157
157 -
 158
158 -
 159
159 -
 160
160 -
 161
161 -
 162
162 -
 163
163 -
 164
164 -
 165
165 -
 166
166 -
 167
167 -
 168
168 -
169
-
170
-
171
-
172
-
173
-
174
-
175
-
176
-
177
-
178
-
179
-
180
-
181
-
182
-
183
-
184
-
185
-
186
-
187
-
188
-
189
-
190
-
191
-
192
-
193
-
194
-
195
-
196
-
197
-
198
-
199
-
200
-
201
-
202
-
203
-
204
-
205
-
206
-
207
-
208
-
209
-
210
-
211
-
212
-
213
-
214
-
215
-
216
-
217
-
218
-
219
-
220
-
221
-
222
-
223
-
224
-
225
-
226
-
227
-
228
-
229
-
230
-
231
-
232
-
233
-
234
-
235
-
236
-
237
-
238
-
239
-
240
-
241
-
242
-
243
-
244
-
245
-
246
-
247
-
248
-
249
-
250
-
251
-
252
 |
 |

155
Management Report
132 Audi Group
140 Business and
underlying situation
153 Financial performance
indicators
153 Financial performance
155 Net worth
156 Financial position
157 Social and ecological aspects
168 Risks, opportunities
and outlook
177 Disclaimer
KEY EARNINGS DATA
% 2009 2008
Operating return on sales 5.4 8.1
Return on sales before tax 6.5 9.3
Equity return after tax 12.9 23.3
Return on investment 11.5 19.8
The Company’s healthy cost structure and sustained high profitability are also reflected in the
key return ratios for 2009.
Despite the massive burdens caused by the financial and economic crisis, the Audi Group
achieved an outstanding operating return on sales of 5.4 (8.1) percent and a return on sales
before tax of 6.5 (9.3) percent in the past fiscal year. The Company’s return on investment over
the same period was an impressive 11.5 (19.8) percent. The Audi Group was thus again one of
the most profitable premium-segment automotive manufacturers in the world in 2009.
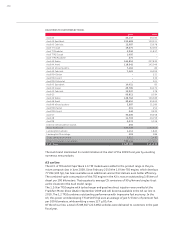
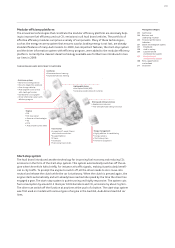
NET WORTH
BALANCE SHEET STRUCTURE (EUR MILLION)
2009200820072006 2006200720082009
26,550 22,578 18,91022,57818,910 26,056 26,550 26,056
Fixed assetsFixed assets
Other non-current assetsOther non-current assets
Inventories
Other current assets
Cash and cash equivalents
InventoriesInventories
Other current assetsOther current assets
Cash and cash equivalentsCash and cash equivalents
Equity
Non-current liabilities
Current liabilities
7,379
7,536
946
749
2,661
2,109 4,852
6,740
3,632
4,884
8,190
1,347
3,347
8,339
4,833
8,355
5,269
8,954
7,265
4,610
7,035
10,328
6,029
9,699
Non-current assets:
Current assets:
8,296
1,340
2,568
7,890
6,455
10,632
6,425
9,493