Audi 2009 Annual Report Download - page 2
Download and view the complete annual report
Please find page 2 of the 2009 Audi annual report below. You can navigate through the pages in the report by either clicking on the pages listed below, or by using the keyword search tool below to find specific information within the annual report.-
 1
1 -
 2
2 -
 3
3 -
 4
4 -
 5
5 -
 6
6 -
 7
7 -
 8
8 -
 9
9 -
 10
10 -
 11
11 -
 12
12 -
 13
13 -
14
-
15
-
16
-
17
-
18
-
19
-
20
-
21
-
22
-
23
-
24
-
25
-
26
-
27
-
28
-
29
-
30
-
31
-
32
-
33
-
34
-
35
-
36
-
37
-
38
-
39
-
40
-
41
-
42
-
43
-
44
-
45
-
46
-
47
-
48
-
49
-
50
-
51
-
52
-
53
-
54
-
55
-
56
-
57
-
58
-
59
-
60
-
61
-
62
-
63
-
64
-
65
-
66
-
67
-
68
-
69
-
70
-
71
-
72
-
73
-
74
-
75
-
76
-
77
-
78
-
79
-
80
-
81
-
82
-
83
-
84
-
85
-
86
-
87
-
88
-
89
-
90
-
91
-
92
-
93
-
94
-
95
-
96
-
97
-
98
-
99
-
100
-
101
-
102
-
103
-
104
-
105
-
106
-
107
-
108
-
109
-
110
-
111
-
112
-
113
-
114
-
115
-
116
-
117
-
118
-
119
-
120
-
121
-
122
-
123
-
124
-
125
-
126
-
127
-
128
-
129
-
130
-
131
-
132
-
133
-
134
-
135
-
136
-
137
-
138
-
139
-
140
-
141
-
142
-
143
-
144
-
145
-
146
-
147
-
148
-
149
-
150
-
151
-
152
-
153
-
154
-
155
-
156
-
157
-
158
-
159
-
160
-
161
-
162
-
163
-
164
-
165
-
166
-
167
-
168
-
169
-
170
-
171
-
172
-
173
-
174
-
175
-
176
-
177
-
178
-
179
-
180
-
181
-
182
-
183
-
184
-
185
-
186
-
187
-
188
-
189
-
190
-
191
-
192
-
193
-
194
-
195
-
196
-
197
-
198
-
199
-
200
-
201
-
202
-
203
-
204
-
205
-
206
-
207
-
208
-
209
-
210
-
211
-
212
-
213
-
214
-
215
-
216
-
217
-
218
-
219
-
220
-
221
-
222
-
223
-
224
-
225
-
226
-
227
-
228
-
229
-
230
-
231
-
232
-
233
-
234
-
235
-
236
-
237
-
238
-
239
-
240
-
241
-
242
-
243
-
244
-
245
-
246
-
247
-
248
-
249
-
250
-
251
-
252
 |
 |
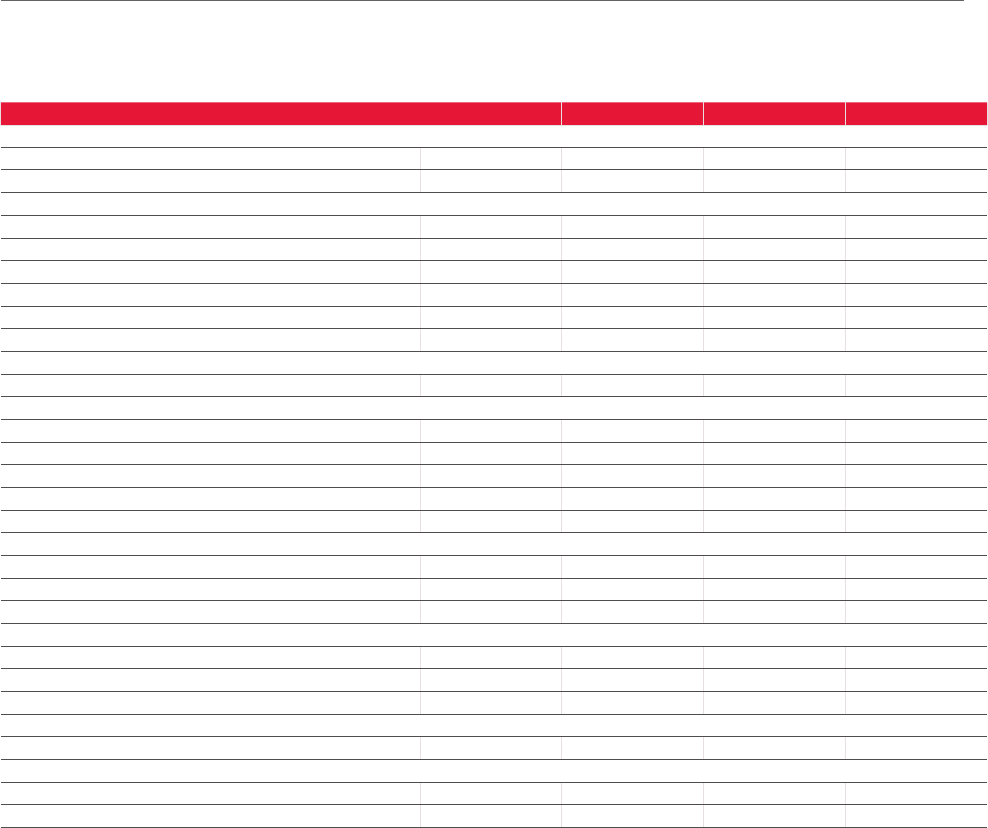
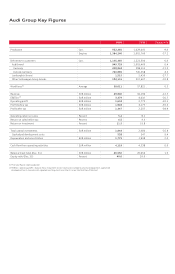
Audi Group Key Figures
2009 2008 Change in %
Production Cars 932,260 1,029,041 -9.4
Engines 1,384,240 1,901,760 -27.2
Deliveries to customers Cars 1,145,360 1,223,506 -6.4
Audi brand 949,729 1,003,469 -5.4
Germany 228,844 258,111 -11.3
Outside Germany 720,885 745,358 -3.3
Lamborghini brand 1,515 2,430 -37.7
Other Volkswagen Group brands 194,116 217,607 -10.8
Workforce 1) Average 58,011 57,822 0.3
Revenue EUR million 29,840 34,196 -12.7
EBITDA 2) EUR million 3,379 4,610 -26.7
Operating profit EUR million 1,604 2,772 -42.1
Profit before tax EUR million 1,928 3,177 -39.3
Profit after tax EUR million 1,347 2,207 -38.9
Operating return on sales Percent 5.4 8.1
Return on sales before tax Percent 6.5 9.3
Return on investment Percent 11.5 19.8
Total capital investments EUR million 1,844 2,486 -25.8
Capitalized development costs 528 547 -3.4
Depreciation and amortization EUR million 1,775 1,908 -7.0
Cash flow from operating activities EUR million 4,119 4,338 -5.0
Balance sheet total (Dec. 31) EUR million 26,550 26,056 1.9
Equity ratio (Dec. 31) Percent 40.0 39.6
1) Prior-year figure slightly adjusted
2)
EBITDA = operating profit + balance from impairment losses (reversals) on property, plant and equipment, capitalized
development costs, leased assets, goodwill and long-term investments as per the Cash Flow Statement