Audi 2009 Annual Report Download - page 189
Download and view the complete annual report
Please find page 189 of the 2009 Audi annual report below. You can navigate through the pages in the report by either clicking on the pages listed below, or by using the keyword search tool below to find specific information within the annual report.-
 1
1 -
2
-
3
-
4
-
5
-
6
-
7
-
8
-
9
-
10
-
11
-
12
-
13
-
14
-
15
-
16
-
17
-
18
-
19
-
20
-
21
-
22
-
23
-
24
-
25
-
26
-
27
-
28
-
29
-
30
-
31
-
32
-
33
-
34
-
35
-
36
-
37
-
38
-
39
-
40
-
41
-
42
-
43
-
44
-
45
-
46
-
47
-
48
-
49
-
50
-
51
-
52
-
53
-
54
-
55
-
56
-
57
-
58
-
59
-
60
-
61
-
62
-
63
-
64
-
65
-
66
-
67
-
68
-
69
-
70
-
71
-
72
-
73
-
74
-
75
-
76
-
77
-
78
-
79
-
80
-
81
-
82
-
83
-
84
-
85
-
86
-
87
-
88
-
89
-
90
-
91
-
92
-
93
-
94
-
95
-
96
-
97
-
98
-
99
-
100
-
101
-
102
-
103
-
104
-
105
-
106
-
107
-
108
-
109
-
110
-
111
-
112
-
113
-
114
-
115
-
116
-
117
-
118
-
119
-
120
-
121
-
122
-
123
-
124
-
125
-
126
-
127
-
128
-
129
-
130
-
131
-
132
-
133
-
134
-
135
-
136
-
137
-
138
-
139
-
140
-
141
-
142
-
143
-
144
-
145
-
146
-
147
-
148
-
149
-
150
-
151
-
152
-
153
-
154
-
155
-
156
-
157
-
158
-
159
-
160
-
161
-
162
-
163
-
164
-
165
-
166
-
167
-
168
-
169
-
170
-
171
-
172
-
173
-
174
-
175
-
176
-
177
-
178
-
 179
179 -
 180
180 -
 181
181 -
 182
182 -
 183
183 -
 184
184 -
 185
185 -
 186
186 -
 187
187 -
 188
188 -
 189
189 -
 190
190 -
 191
191 -
 192
192 -
 193
193 -
 194
194 -
 195
195 -
 196
196 -
 197
197 -
 198
198 -
 199
199 -
200
-
201
-
202
-
203
-
204
-
205
-
206
-
207
-
208
-
209
-
210
-
211
-
212
-
213
-
214
-
215
-
216
-
217
-
218
-
219
-
220
-
221
-
222
-
223
-
224
-
225
-
226
-
227
-
228
-
229
-
230
-
231
-
232
-
233
-
234
-
235
-
236
-
237
-
238
-
239
-
240
-
241
-
242
-
243
-
244
-
245
-
246
-
247
-
248
-
249
-
250
-
251
-
252
 |
 |
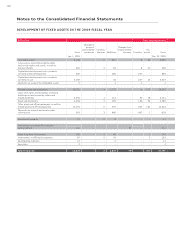
186
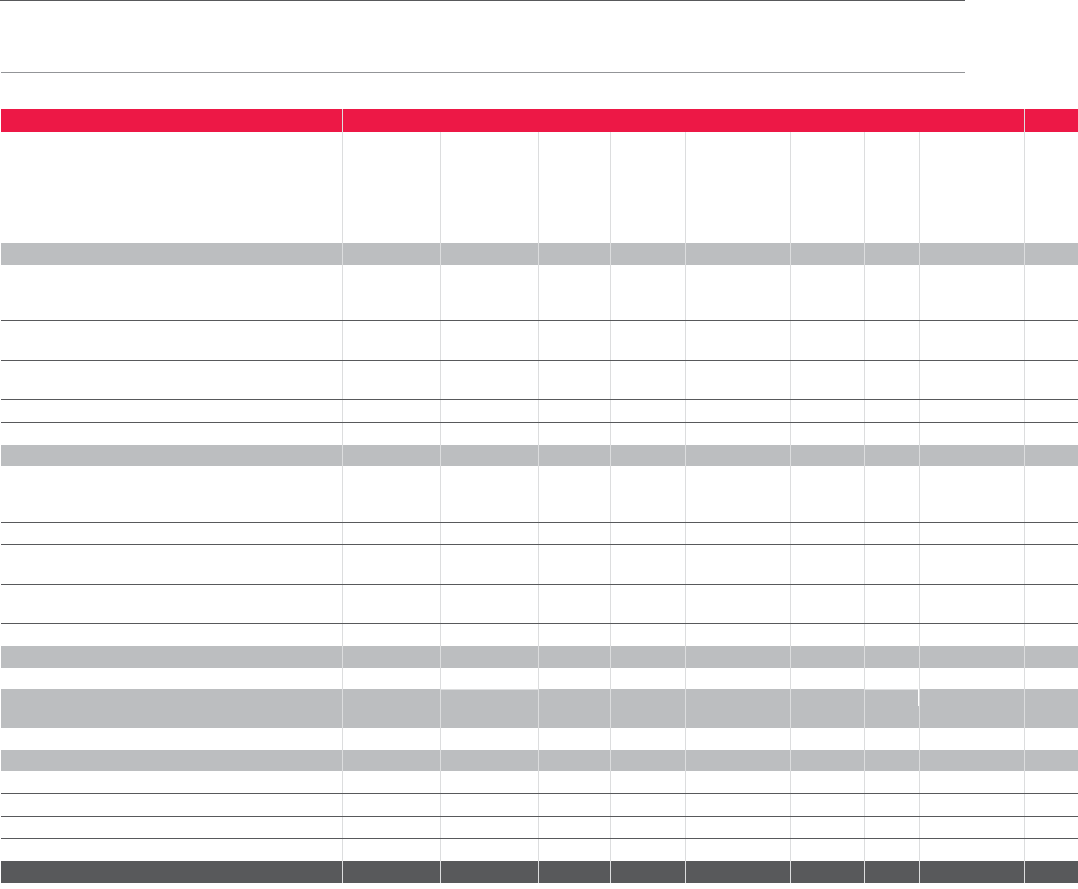
DEVELOPMENT OF FIXED ASSETS IN THE 2008 FISCAL YEAR
EUR million Gross carrying amounts
Costs
Changes in
group of
consolidated
companies Currency
changes Additions
Changes from
measurement
at equity Transfers Dis-
posals Costs
Jan. 1, 2008 Dec. 31, 2008
Intangible assets 3,896 14 –660 – 1 465 4,106
Concessions, industrial property rights
and similar rights and assets, as well as
licenses thereto 362 14 –111 – 1 53 435
Capitalized development costs, products
currently under development 612 – – 369 – – 351 –630
Capitalized development costs, products
currently in use 2,922 – – 178 – 351 412 3,039
Payments on account for intangible assets – – – 2 – – – 2
Property, plant and equipment 17,279 693 61,793 – 4 524 19,251
Land, land rights and buildings, including
buildings on land owned by others and
leased buildings 3,457 288 6174 – 57 47 3,935
Plant and machinery 4,181 143 –184 – 142 132 4,518
Other plant and office equipment, as well as
leased plant and office equipment 9,190 262 –895 – 189 341 10,195
Payments on account and assets under
construction 451 – – 540 – – 384 4603
Investment property 13 – 2 – – – 5 –10
Investments accounted for using the
equity method 121 –15 –16 – –152
Other long-term investments 189 – 123 133 – – –100
Investments in affiliated companies 178 – 123 131 – – –87
Participating interests 11 – – – – – –11
Securities – – – 2 – – – 2
Total fixed assets 21,498 584 24 2,486 16 – 989 23,619