Audi 2009 Annual Report Download - page 160
Download and view the complete annual report
Please find page 160 of the 2009 Audi annual report below. You can navigate through the pages in the report by either clicking on the pages listed below, or by using the keyword search tool below to find specific information within the annual report.-
 1
1 -
2
-
3
-
4
-
5
-
6
-
7
-
8
-
9
-
10
-
11
-
12
-
13
-
14
-
15
-
16
-
17
-
18
-
19
-
20
-
21
-
22
-
23
-
24
-
25
-
26
-
27
-
28
-
29
-
30
-
31
-
32
-
33
-
34
-
35
-
36
-
37
-
38
-
39
-
40
-
41
-
42
-
43
-
44
-
45
-
46
-
47
-
48
-
49
-
50
-
51
-
52
-
53
-
54
-
55
-
56
-
57
-
58
-
59
-
60
-
61
-
62
-
63
-
64
-
65
-
66
-
67
-
68
-
69
-
70
-
71
-
72
-
73
-
74
-
75
-
76
-
77
-
78
-
79
-
80
-
81
-
82
-
83
-
84
-
85
-
86
-
87
-
88
-
89
-
90
-
91
-
92
-
93
-
94
-
95
-
96
-
97
-
98
-
99
-
100
-
101
-
102
-
103
-
104
-
105
-
106
-
107
-
108
-
109
-
110
-
111
-
112
-
113
-
114
-
115
-
116
-
117
-
118
-
119
-
120
-
121
-
122
-
123
-
124
-
125
-
126
-
127
-
128
-
129
-
130
-
131
-
132
-
133
-
134
-
135
-
136
-
137
-
138
-
139
-
140
-
141
-
142
-
143
-
144
-
145
-
146
-
147
-
148
-
149
-
 150
150 -
 151
151 -
 152
152 -
 153
153 -
 154
154 -
 155
155 -
 156
156 -
 157
157 -
 158
158 -
 159
159 -
 160
160 -
 161
161 -
 162
162 -
 163
163 -
 164
164 -
 165
165 -
 166
166 -
 167
167 -
 168
168 -
 169
169 -
 170
170 -
171
-
172
-
173
-
174
-
175
-
176
-
177
-
178
-
179
-
180
-
181
-
182
-
183
-
184
-
185
-
186
-
187
-
188
-
189
-
190
-
191
-
192
-
193
-
194
-
195
-
196
-
197
-
198
-
199
-
200
-
201
-
202
-
203
-
204
-
205
-
206
-
207
-
208
-
209
-
210
-
211
-
212
-
213
-
214
-
215
-
216
-
217
-
218
-
219
-
220
-
221
-
222
-
223
-
224
-
225
-
226
-
227
-
228
-
229
-
230
-
231
-
232
-
233
-
234
-
235
-
236
-
237
-
238
-
239
-
240
-
241
-
242
-
243
-
244
-
245
-
246
-
247
-
248
-
249
-
250
-
251
-
252
 |
 |
157
Management Report
132 Audi Group
140 Business and
underlying situation
153 Financial performance
indicators
153 Financial performance
155 Net worth
156 Financial position
157 Social and ecological aspects
157 Employees
159 Audi in society
160 Location-based
environmental aspects
163 Product-based
environmental aspects
168 Risks, opportunities
and outlook
177 Disclaimer
SOCIAL AND ECOLOGICAL ASPECTS
EMPLOYEES
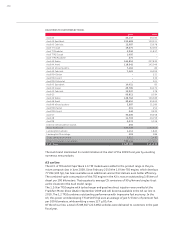
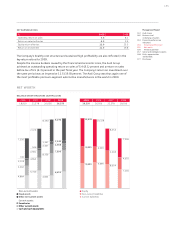
Workforce
Average for the year 2009 2008
Domestic companies 45,408 45,008
of which:
AUDI AG 44,344 44,098
Ingolstadt plant 31,409 31,358
Neckarsulm plant 12,935 12,740
Foreign companies 10,200 10,468
of which:
AUDI BRUSSELS S.A./N.V. 2,153 2,134
AUDI HUNGARIA MOTOR Kft. 5,614 5,925
Lamborghini Group 1) 1,000 987
VOLKSWAGEN GROUP ITALIA S.P.A. 2) 902 894
Employees 55,608 55,476
Apprentices 2,115 2,057
Employees of Audi Group companies 57,723 57,533
Staff employed from other Volkswagen Group companies
not belonging to the Audi Group 288 289
Workforce 58,011 57,822
1) excluding VOLKSWAGEN GROUP ITALIA S.P.A. and VOLKSWAGEN GROUP FIRENZE S.P.A.
2) excluding VOLKSWAGEN GROUP FIRENZE S.P.A.
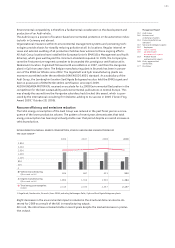
The Audi Group workforce averaged 58,011 (57,822) employees in the 2009 fiscal year; its size
was therefore slightly up on the previous year, despite the difficult economic situation. AUDI AG
recruited 400 experts mainly in engineering sciences during the past year. The Company in addi-
tion increased the number of apprenticeships available in 2009 and resolved to recruit a further
100 people in 2010 as part of an apprenticeship campaign to mark the 100th anniversary. The
personnel total at AUDI HUNGARIA MOTOR Kft. was down on the previous year due to reduced
engine and vehicle production volume.
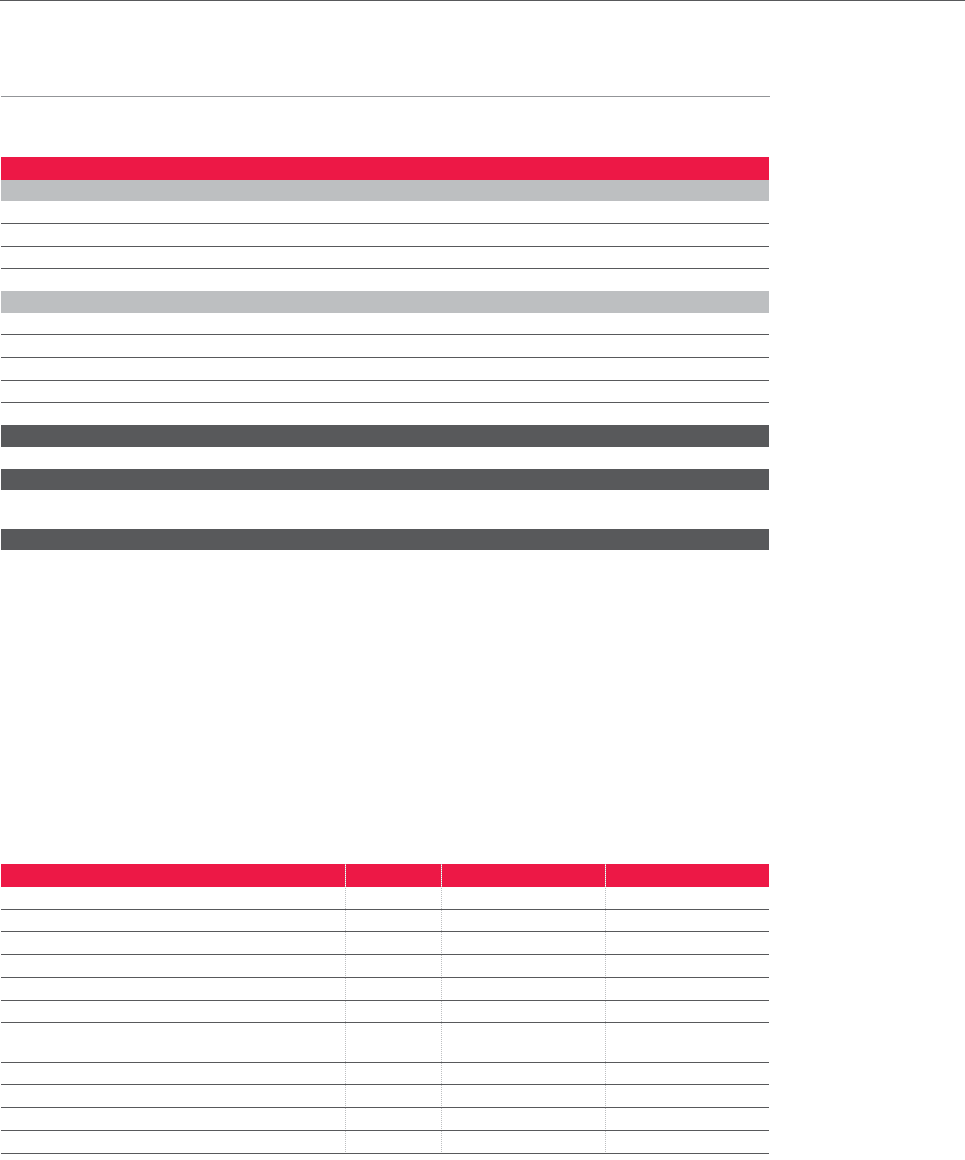
EMPLOYEE STRUCTURAL DATA (AUDI AG)
2009 2008
Average age 1) Years 40.5 40.0
Average length of service 1) Years 16.3 15.7
Proportion of women 1) Percent 11.9 11.7
Proportion of academics Percent 35.1 33.5
Proportion of foreign nationals Percent 7.9 8.2
Proportion of people with severe disabilities Percent 5.7 5.3
Contracts to workshops for people with
mental disabilities EUR million 5.6 4.5
Frequency of accidents 2) 2.4 2.3
Attendance rate Percent 96.8 97.0
Savings through Audi suggestions award program EUR million 51.1 52.8
Implementation quota Percent 54.8 56.8
1) Audi Group manufacturing plants
2) The accident frequency figure indicates how many industrial accidents involving one or more days’ work lost occur per
million hours worked.