Audi 2009 Annual Report Download - page 221
Download and view the complete annual report
Please find page 221 of the 2009 Audi annual report below. You can navigate through the pages in the report by either clicking on the pages listed below, or by using the keyword search tool below to find specific information within the annual report.-
 1
1 -
2
-
3
-
4
-
5
-
6
-
7
-
8
-
9
-
10
-
11
-
12
-
13
-
14
-
15
-
16
-
17
-
18
-
19
-
20
-
21
-
22
-
23
-
24
-
25
-
26
-
27
-
28
-
29
-
30
-
31
-
32
-
33
-
34
-
35
-
36
-
37
-
38
-
39
-
40
-
41
-
42
-
43
-
44
-
45
-
46
-
47
-
48
-
49
-
50
-
51
-
52
-
53
-
54
-
55
-
56
-
57
-
58
-
59
-
60
-
61
-
62
-
63
-
64
-
65
-
66
-
67
-
68
-
69
-
70
-
71
-
72
-
73
-
74
-
75
-
76
-
77
-
78
-
79
-
80
-
81
-
82
-
83
-
84
-
85
-
86
-
87
-
88
-
89
-
90
-
91
-
92
-
93
-
94
-
95
-
96
-
97
-
98
-
99
-
100
-
101
-
102
-
103
-
104
-
105
-
106
-
107
-
108
-
109
-
110
-
111
-
112
-
113
-
114
-
115
-
116
-
117
-
118
-
119
-
120
-
121
-
122
-
123
-
124
-
125
-
126
-
127
-
128
-
129
-
130
-
131
-
132
-
133
-
134
-
135
-
136
-
137
-
138
-
139
-
140
-
141
-
142
-
143
-
144
-
145
-
146
-
147
-
148
-
149
-
150
-
151
-
152
-
153
-
154
-
155
-
156
-
157
-
158
-
159
-
160
-
161
-
162
-
163
-
164
-
165
-
166
-
167
-
168
-
169
-
170
-
171
-
172
-
173
-
174
-
175
-
176
-
177
-
178
-
179
-
180
-
181
-
182
-
183
-
184
-
185
-
186
-
187
-
188
-
189
-
190
-
191
-
192
-
193
-
194
-
195
-
196
-
197
-
198
-
199
-
200
-
201
-
202
-
203
-
204
-
205
-
206
-
207
-
208
-
209
-
210
-
 211
211 -
 212
212 -
 213
213 -
 214
214 -
 215
215 -
 216
216 -
 217
217 -
 218
218 -
 219
219 -
 220
220 -
 221
221 -
 222
222 -
 223
223 -
 224
224 -
 225
225 -
 226
226 -
 227
227 -
 228
228 -
 229
229 -
 230
230 -
 231
231 -
232
-
233
-
234
-
235
-
236
-
237
-
238
-
239
-
240
-
241
-
242
-
243
-
244
-
245
-
246
-
247
-
248
-
249
-
250
-
251
-
252
 |
 |
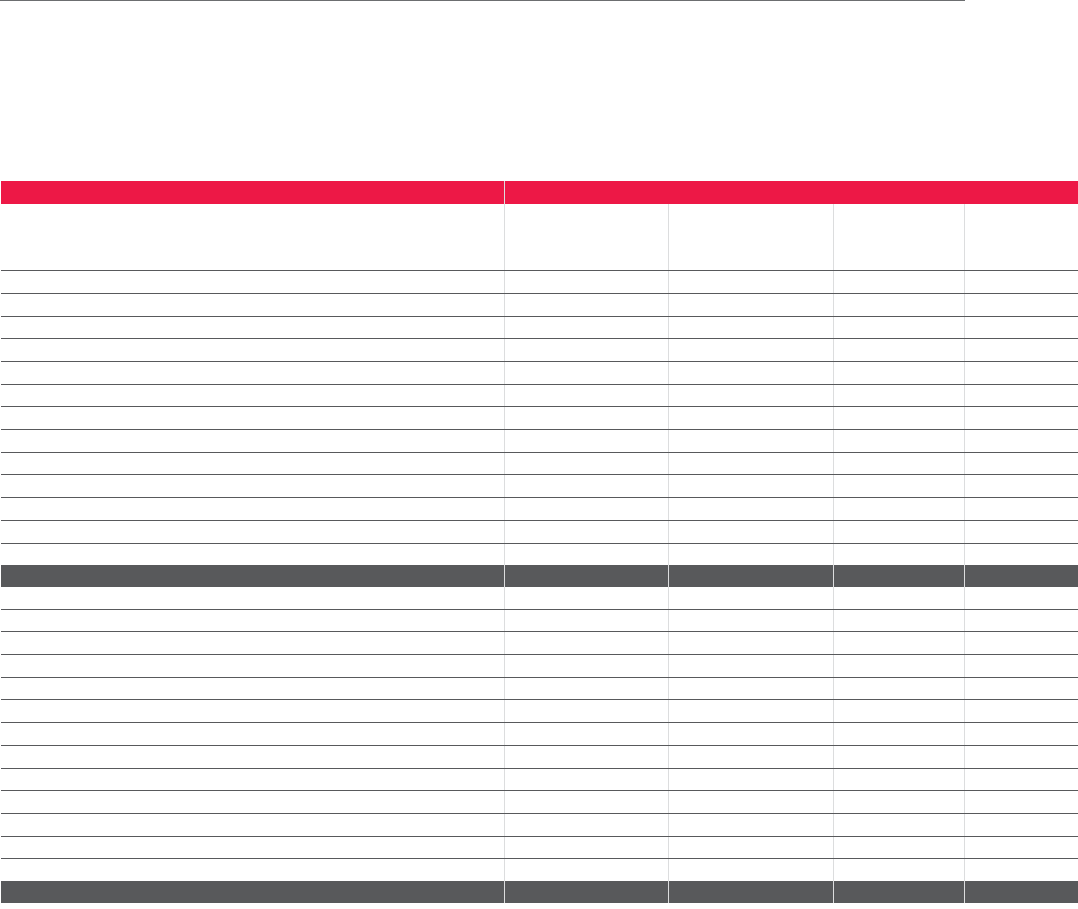
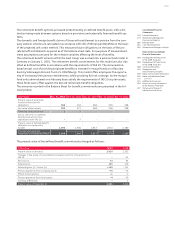
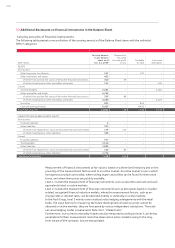
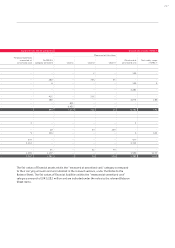
218
EUR million
Carrying amount as
per balance sheet
as of Dec. 31, 2008 Measured at fair value
through profit or loss Available
for sale
ASSETS
Non-current
Other long-term investments 75 – 75
Other receivables and assets 656
of which from positive fair values of derivative financial instruments 555 – –
of which miscellaneous other receivables and assets 101 – –
Current
Trade receivables 2,215 – –
Other receivables and assets 5,318
of which from positive fair values of derivative financial instruments 579 129 –
of which miscellaneous other receivables and assets 4,739 – –
Securities 789 – 789
Cash and cash equivalents 4,833 – 4,833
Total financial assets 13,886 129 5,697
LIABILITIES AND SHAREHOLDERS’ EQUITY
Non-current
Financial liabilities 3– –
Other liabilities 447
of which from negative fair values of derivative financial instruments 122 17 –
of which miscellaneous other liabilities 325 – –
Current
Financial liabilities 673 – –
Trade payables 3,302 – –
Other liabilities 3,094
of which from negative fair values of derivative financial instruments 120 30 –
of which miscellaneous other liabilities 2,974 – –
Total financial liabilities 7,519 47 –