Audi 2009 Annual Report Download - page 223
Download and view the complete annual report
Please find page 223 of the 2009 Audi annual report below. You can navigate through the pages in the report by either clicking on the pages listed below, or by using the keyword search tool below to find specific information within the annual report.-
 1
1 -
2
-
3
-
4
-
5
-
6
-
7
-
8
-
9
-
10
-
11
-
12
-
13
-
14
-
15
-
16
-
17
-
18
-
19
-
20
-
21
-
22
-
23
-
24
-
25
-
26
-
27
-
28
-
29
-
30
-
31
-
32
-
33
-
34
-
35
-
36
-
37
-
38
-
39
-
40
-
41
-
42
-
43
-
44
-
45
-
46
-
47
-
48
-
49
-
50
-
51
-
52
-
53
-
54
-
55
-
56
-
57
-
58
-
59
-
60
-
61
-
62
-
63
-
64
-
65
-
66
-
67
-
68
-
69
-
70
-
71
-
72
-
73
-
74
-
75
-
76
-
77
-
78
-
79
-
80
-
81
-
82
-
83
-
84
-
85
-
86
-
87
-
88
-
89
-
90
-
91
-
92
-
93
-
94
-
95
-
96
-
97
-
98
-
99
-
100
-
101
-
102
-
103
-
104
-
105
-
106
-
107
-
108
-
109
-
110
-
111
-
112
-
113
-
114
-
115
-
116
-
117
-
118
-
119
-
120
-
121
-
122
-
123
-
124
-
125
-
126
-
127
-
128
-
129
-
130
-
131
-
132
-
133
-
134
-
135
-
136
-
137
-
138
-
139
-
140
-
141
-
142
-
143
-
144
-
145
-
146
-
147
-
148
-
149
-
150
-
151
-
152
-
153
-
154
-
155
-
156
-
157
-
158
-
159
-
160
-
161
-
162
-
163
-
164
-
165
-
166
-
167
-
168
-
169
-
170
-
171
-
172
-
173
-
174
-
175
-
176
-
177
-
178
-
179
-
180
-
181
-
182
-
183
-
184
-
185
-
186
-
187
-
188
-
189
-
190
-
191
-
192
-
193
-
194
-
195
-
196
-
197
-
198
-
199
-
200
-
201
-
202
-
203
-
204
-
205
-
206
-
207
-
208
-
209
-
210
-
211
-
212
-
 213
213 -
 214
214 -
 215
215 -
 216
216 -
 217
217 -
 218
218 -
 219
219 -
 220
220 -
 221
221 -
 222
222 -
 223
223 -
 224
224 -
 225
225 -
 226
226 -
 227
227 -
 228
228 -
 229
229 -
 230
230 -
 231
231 -
 232
232 -
 233
233 -
234
-
235
-
236
-
237
-
238
-
239
-
240
-
241
-
242
-
243
-
244
-
245
-
246
-
247
-
248
-
249
-
250
-
251
-
252
 |
 |

220
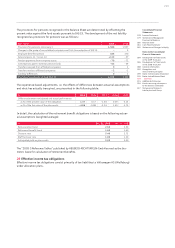
Reconciliation statement for financial instruments measured according to level 3
EUR million 2009
Positive fair values of level 3 derivative financial instruments at Jan. 1 –
Income and expense (–) recognized in the financial result 15
Income and expense (–) recognized in equity 53
Reclassification from level 3 to level 2 – 12
Positive fair values of level 3 derivative financial instruments at Dec. 31 55
Income and expense (–) recognized in the financial result from
level 3 derivative financial instruments still held at Dec. 31 4
Negative fair values of level 3 derivative financial instruments at Jan. 1 – 23
Income and expense (–) recognized in the profit from operating activities – 224
Income and expense (–) recognized in the financial result 2
Income and expense (–) recognized in equity 11
Reclassification from level 3 to level 2 10
Negative fair values of level 3 derivative financial instruments at Dec. 31 – 224
Income and expense (–) recognized in the profit from operating activities from
level 3 derivative financial instruments still held at Dec. 31 – 224
Income and expense (–) recognized in the financial result from
level 3 derivative financial instruments still held at Dec. 31 –
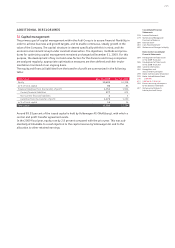
The residual value hedging model is categorically allocated to level 3. The reclassifications from
level 3 to level 2 contain commodity futures for whose measurement it is no longer necessary to
extrapolate the exchange rates because these can now be observed again on the active market.
The effects of market price changes of used cars resulting from hedging arrangements are
shown in detail under Note 34.3, “Market risks.”
Risks resulting from residual value fluctuations of the derivative financial instruments measured
according to level 3 are calculated within the Audi Group by means of sensitivity analyses. In this
way, effects of changes in commodity price listings on profit and equity are shown. A 10 percent
rise (fall) in the commodity prices of commodity futures measured according to level 3 at
December 31, 2009 would have an effect of EUR 21 million (EUR – 21 million), primarily on
equity.
Pursuant to IFRS 7, in the first year of adopting the changes no comparative values for the pre-
vious year have to be given. The amended IFRS 7 was used in the Audi Group for the first time
in 2009.
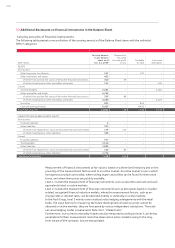
34 Management of financial risks
34.1 Credit risks
Credit risks from financial assets comprise the risk of default by a contractual party and there-
fore do not exceed the positive fair values in respect of the contractual party in question. The
risk from non-derivative financial instruments is covered by value adjustments for expected loss
of receivables. The contractual partners for cash and capital investments, as well as currency and
raw materials hedging instruments, have impeccable credit standings. Over and above this, the
risks are restricted by a limit system that is based on the credit ratings of international rating
agencies and the equity base of the contractual parties.
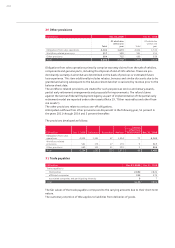
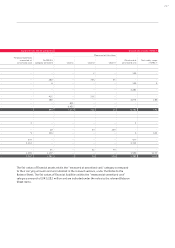
The credit quality of financial assets measured at amortized cost is shown in the following table:
EUR million
Gross carrying
amount as of
Dec. 31, 2009
Neither past
due nor
impaired Past due and
not impaired Impaired
Measured at amortized cost
Trade receivables 2,314 1,682 573 60
Other receivables 4,243 4,132 43 68
of which receivables from loans 3,966 3,965 0 1
of which miscellaneous receivables 277 167 42 67
Total 6,557 5,814 615 128