Audi 2009 Annual Report Download - page 225
Download and view the complete annual report
Please find page 225 of the 2009 Audi annual report below. You can navigate through the pages in the report by either clicking on the pages listed below, or by using the keyword search tool below to find specific information within the annual report.-
 1
1 -
2
-
3
-
4
-
5
-
6
-
7
-
8
-
9
-
10
-
11
-
12
-
13
-
14
-
15
-
16
-
17
-
18
-
19
-
20
-
21
-
22
-
23
-
24
-
25
-
26
-
27
-
28
-
29
-
30
-
31
-
32
-
33
-
34
-
35
-
36
-
37
-
38
-
39
-
40
-
41
-
42
-
43
-
44
-
45
-
46
-
47
-
48
-
49
-
50
-
51
-
52
-
53
-
54
-
55
-
56
-
57
-
58
-
59
-
60
-
61
-
62
-
63
-
64
-
65
-
66
-
67
-
68
-
69
-
70
-
71
-
72
-
73
-
74
-
75
-
76
-
77
-
78
-
79
-
80
-
81
-
82
-
83
-
84
-
85
-
86
-
87
-
88
-
89
-
90
-
91
-
92
-
93
-
94
-
95
-
96
-
97
-
98
-
99
-
100
-
101
-
102
-
103
-
104
-
105
-
106
-
107
-
108
-
109
-
110
-
111
-
112
-
113
-
114
-
115
-
116
-
117
-
118
-
119
-
120
-
121
-
122
-
123
-
124
-
125
-
126
-
127
-
128
-
129
-
130
-
131
-
132
-
133
-
134
-
135
-
136
-
137
-
138
-
139
-
140
-
141
-
142
-
143
-
144
-
145
-
146
-
147
-
148
-
149
-
150
-
151
-
152
-
153
-
154
-
155
-
156
-
157
-
158
-
159
-
160
-
161
-
162
-
163
-
164
-
165
-
166
-
167
-
168
-
169
-
170
-
171
-
172
-
173
-
174
-
175
-
176
-
177
-
178
-
179
-
180
-
181
-
182
-
183
-
184
-
185
-
186
-
187
-
188
-
189
-
190
-
191
-
192
-
193
-
194
-
195
-
196
-
197
-
198
-
199
-
200
-
201
-
202
-
203
-
204
-
205
-
206
-
207
-
208
-
209
-
210
-
211
-
212
-
213
-
214
-
 215
215 -
 216
216 -
 217
217 -
 218
218 -
 219
219 -
 220
220 -
 221
221 -
 222
222 -
 223
223 -
 224
224 -
 225
225 -
 226
226 -
 227
227 -
 228
228 -
 229
229 -
 230
230 -
 231
231 -
 232
232 -
 233
233 -
 234
234 -
 235
235 -
236
-
237
-
238
-
239
-
240
-
241
-
242
-
243
-
244
-
245
-
246
-
247
-
248
-
249
-
250
-
251
-
252
 |
 |

222
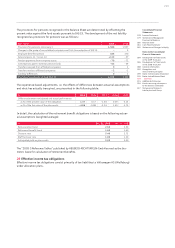
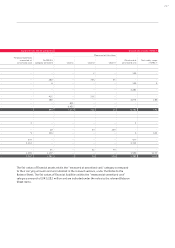
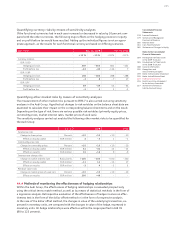
Value adjustments
Developments of value adjustments of claims that existed on the balance sheet date and
that were measured at amortized cost can be broken down as follows for the 2009 and
2008 fiscal years:
EUR million 2009 Specific value
adjustment 2008 Specific value
adjustment
Position as of January 1 37 37 19 19
Addition 76 76 26 26
Utilization – 13 – 13 – 8 – 8
Dissolution – 2 – 2– –
Position as of December 31 98 98 37 37
Portfolio-based write-downs are not used within the Audi Group.
Collateral
The Audi Group recorded financial assets as collateral for liabilities in the amount of EUR 170
(82) million. This collateral is used primarily as soon as credit periods for secured liabilities are
exceeded.
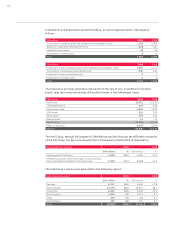
34.2 Liquidity risks
Liquidity risks arise from financial liabilities if current payment obligations can no longer be
met. A liquidity forecast based on a fixed planning horizon coupled with available yet unused
lines of credit assure adequate liquidity at all times in the Audi Group.
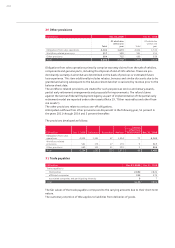
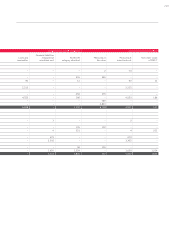
Analysis by maturity date of undiscounted cash used for financial liabilities
The financial liabilities reported as of the balance sheet date are categorized separately by
maturity date in the following table:
EUR million Total Residual contractual maturities
Dec. 31, 2009 Up to 1 year 1 to 5 years Over 5 years
Financial liabilities 579 577 – 2
Trade payables 3,114 3,114 – –
Other financial liabilities 1,599 1,473 5 120
Derivatives used as hedges 9,413 4,608 4,780 25
Total 14,705 9,772 4,786 147
EUR million Total Residual contractual maturities
Dec. 31, 2008 Up to 1 year 1 bis 5 Jahre Over 5 years
Financial liabilities 676 673 2 1
Trade payables 3,302 3,302 – –
Other financial liabilities 1,650 1,623 27 –
Derivatives used as hedges 12,685 5,243 7,442 –
Total 18,313 10,841 7,471 1
The cash used for derivatives where gross settlement has been agreed is offset by cash received.
These cash receipts are not presented in the analysis by maturity date. Had the cash receipts
also been taken into account, the cash used would have been significantly lower in the analysis
by maturity date.