Audi 2009 Annual Report Download - page 209
Download and view the complete annual report
Please find page 209 of the 2009 Audi annual report below. You can navigate through the pages in the report by either clicking on the pages listed below, or by using the keyword search tool below to find specific information within the annual report.-
 1
1 -
2
-
3
-
4
-
5
-
6
-
7
-
8
-
9
-
10
-
11
-
12
-
13
-
14
-
15
-
16
-
17
-
18
-
19
-
20
-
21
-
22
-
23
-
24
-
25
-
26
-
27
-
28
-
29
-
30
-
31
-
32
-
33
-
34
-
35
-
36
-
37
-
38
-
39
-
40
-
41
-
42
-
43
-
44
-
45
-
46
-
47
-
48
-
49
-
50
-
51
-
52
-
53
-
54
-
55
-
56
-
57
-
58
-
59
-
60
-
61
-
62
-
63
-
64
-
65
-
66
-
67
-
68
-
69
-
70
-
71
-
72
-
73
-
74
-
75
-
76
-
77
-
78
-
79
-
80
-
81
-
82
-
83
-
84
-
85
-
86
-
87
-
88
-
89
-
90
-
91
-
92
-
93
-
94
-
95
-
96
-
97
-
98
-
99
-
100
-
101
-
102
-
103
-
104
-
105
-
106
-
107
-
108
-
109
-
110
-
111
-
112
-
113
-
114
-
115
-
116
-
117
-
118
-
119
-
120
-
121
-
122
-
123
-
124
-
125
-
126
-
127
-
128
-
129
-
130
-
131
-
132
-
133
-
134
-
135
-
136
-
137
-
138
-
139
-
140
-
141
-
142
-
143
-
144
-
145
-
146
-
147
-
148
-
149
-
150
-
151
-
152
-
153
-
154
-
155
-
156
-
157
-
158
-
159
-
160
-
161
-
162
-
163
-
164
-
165
-
166
-
167
-
168
-
169
-
170
-
171
-
172
-
173
-
174
-
175
-
176
-
177
-
178
-
179
-
180
-
181
-
182
-
183
-
184
-
185
-
186
-
187
-
188
-
189
-
190
-
191
-
192
-
193
-
194
-
195
-
196
-
197
-
198
-
 199
199 -
 200
200 -
 201
201 -
 202
202 -
 203
203 -
 204
204 -
 205
205 -
 206
206 -
 207
207 -
 208
208 -
 209
209 -
 210
210 -
 211
211 -
 212
212 -
 213
213 -
 214
214 -
 215
215 -
 216
216 -
 217
217 -
 218
218 -
 219
219 -
220
-
221
-
222
-
223
-
224
-
225
-
226
-
227
-
228
-
229
-
230
-
231
-
232
-
233
-
234
-
235
-
236
-
237
-
238
-
239
-
240
-
241
-
242
-
243
-
244
-
245
-
246
-
247
-
248
-
249
-
250
-
251
-
252
 |
 |

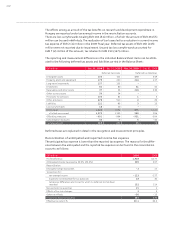
206
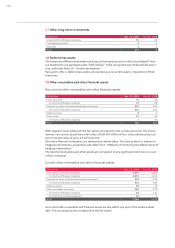
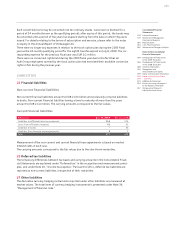
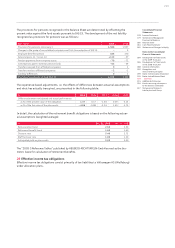
17 Other long-term investments
EUR million Dec. 31, 2009 Dec. 31, 2008
Investments in affiliated companies 95 64
Participating interests 9 9
Securities 2 2
Total 107 75
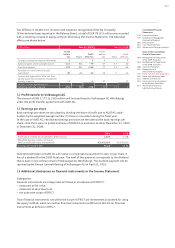
18 Deferred tax assets
The temporary differences between tax bases and carrying amounts in the Consolidated Finan-
cial Statements are explained under “Deferred tax” in the recognition and measurement princi-
ples, and under Note 10, “Income tax expense.”
Pursuant to IAS 1, deferred tax assets are reported as non-current assets, irrespective of their
maturities.
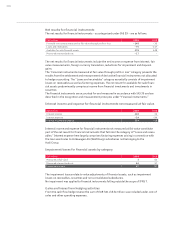
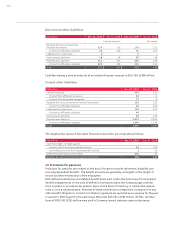
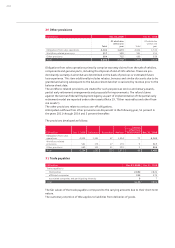
19 Other receivables and other financial assets
Non-current other receivables and other financial assets
EUR million Dec. 31, 2009 Dec. 31, 2008
Loans advanced 75 59
of which to affiliated companies 74 58
Positive fair values of derivative financial instruments 310 555
of which to affiliated companies 310 555
Other tax assets 6 2
Other assets 31 40
of which to affiliated companies – 17
Total 422 656
With regard to loans advanced, the fair values correspond to the carrying amounts. The miscel-
laneous non-current assets have a fair value of EUR 347 (590) million. Loans advanced are sub-
ject to interest rates of up to 4.5 (4.5) percent.
Derivative financial instruments are measured at market value. The total position in relation to
hedging instruments is presented under Note 34.4, “Methods of monitoring the effectiveness of
hedging relationships.”
The reported receivables and other assets are not subject to any significant restrictions on own-
ership or disposal.
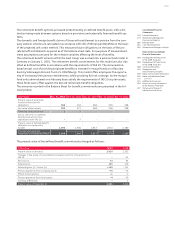
Current other receivables and other financial assets
EUR million Dec. 31, 2009 Dec. 31, 2008
Fixed deposits and loans extended 3,891 4,285
of which to affiliated companies 3,891 4,265
Positive fair values of derivative financial instruments 505 579
of which to affiliated companies 502 569
Other tax assets 99 75
Other receivables and assets 269 379
of which to affiliated companies 33 141
of which to associated companies 20 6
Total 4,764 5,318
All current other receivables and financial assets are due within one year of the balance sheet
date. The carrying amounts correspond to the fair values.