Audi 2009 Annual Report Download - page 219
Download and view the complete annual report
Please find page 219 of the 2009 Audi annual report below. You can navigate through the pages in the report by either clicking on the pages listed below, or by using the keyword search tool below to find specific information within the annual report.-
 1
1 -
2
-
3
-
4
-
5
-
6
-
7
-
8
-
9
-
10
-
11
-
12
-
13
-
14
-
15
-
16
-
17
-
18
-
19
-
20
-
21
-
22
-
23
-
24
-
25
-
26
-
27
-
28
-
29
-
30
-
31
-
32
-
33
-
34
-
35
-
36
-
37
-
38
-
39
-
40
-
41
-
42
-
43
-
44
-
45
-
46
-
47
-
48
-
49
-
50
-
51
-
52
-
53
-
54
-
55
-
56
-
57
-
58
-
59
-
60
-
61
-
62
-
63
-
64
-
65
-
66
-
67
-
68
-
69
-
70
-
71
-
72
-
73
-
74
-
75
-
76
-
77
-
78
-
79
-
80
-
81
-
82
-
83
-
84
-
85
-
86
-
87
-
88
-
89
-
90
-
91
-
92
-
93
-
94
-
95
-
96
-
97
-
98
-
99
-
100
-
101
-
102
-
103
-
104
-
105
-
106
-
107
-
108
-
109
-
110
-
111
-
112
-
113
-
114
-
115
-
116
-
117
-
118
-
119
-
120
-
121
-
122
-
123
-
124
-
125
-
126
-
127
-
128
-
129
-
130
-
131
-
132
-
133
-
134
-
135
-
136
-
137
-
138
-
139
-
140
-
141
-
142
-
143
-
144
-
145
-
146
-
147
-
148
-
149
-
150
-
151
-
152
-
153
-
154
-
155
-
156
-
157
-
158
-
159
-
160
-
161
-
162
-
163
-
164
-
165
-
166
-
167
-
168
-
169
-
170
-
171
-
172
-
173
-
174
-
175
-
176
-
177
-
178
-
179
-
180
-
181
-
182
-
183
-
184
-
185
-
186
-
187
-
188
-
189
-
190
-
191
-
192
-
193
-
194
-
195
-
196
-
197
-
198
-
199
-
200
-
201
-
202
-
203
-
204
-
205
-
206
-
207
-
208
-
 209
209 -
 210
210 -
 211
211 -
 212
212 -
 213
213 -
 214
214 -
 215
215 -
 216
216 -
 217
217 -
 218
218 -
 219
219 -
 220
220 -
 221
221 -
 222
222 -
 223
223 -
 224
224 -
 225
225 -
 226
226 -
 227
227 -
 228
228 -
 229
229 -
230
-
231
-
232
-
233
-
234
-
235
-
236
-
237
-
238
-
239
-
240
-
241
-
242
-
243
-
244
-
245
-
246
-
247
-
248
-
249
-
250
-
251
-
252
 |
 |
216
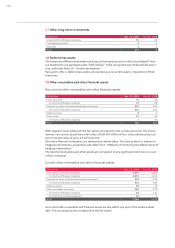
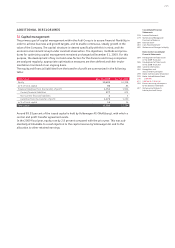
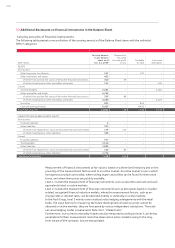
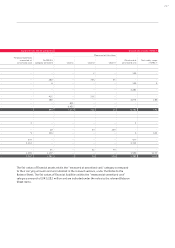
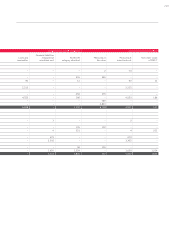
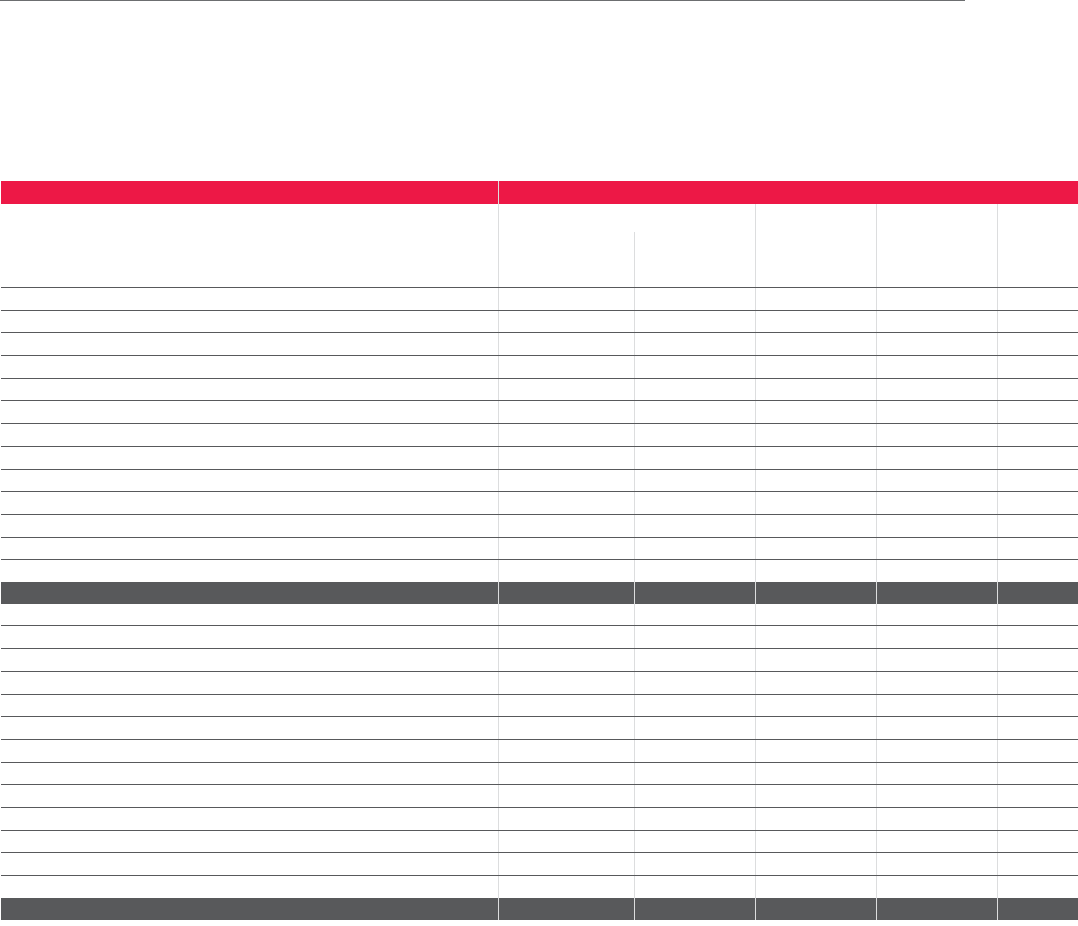
33 Additional disclosures on financial instruments in the Balance Sheet
Carrying amounts of financial instruments
The following table presents a reconciliation of the carrying amounts of the Balance Sheet items with the individual
IFRS 7 categories:
EUR million
Carrying amount
as per balance
sheet as of
Dec. 31, 2009
Measured at
fair value
through profit
or loss Available
for sale Loans and
receivables
ASSETS
Non-current
Other long-term investments 107 – 107 – –
Other receivables and assets 422
of which from positive fair values of derivative financial instruments 310 29 – – –
of which miscellaneous other receivables and assets 111 – – 105 –
Current
Trade receivables 2,281 – – 2,281 –
Other receivables and assets 4,764
of which from positive fair values of derivative financial instruments 505 89 – – –
of which miscellaneous other receivables and assets 4,260 – – 4,073 –
Securities 821 – 821 – –
Cash and cash equivalents 6,455 – 6,455 – –
Total financial assets 14,850 118 7,384 6,459 –
LIABILITIES AND SHAREHOLDERS’ EQUITY
Non-current
Financial liabilities 2– – – –
Other liabilities 527
of which from negative fair values of derivative financial instruments 179 151 – – –
of which miscellaneous other liabilities 348 – – – –
Current
Financial liabilities 577 – – – –
Trade payables 3,114 – – – –
Other liabilities 2,895
of which from negative fair values of derivative financial instruments 120 85 – – –
of which miscellaneous other liabilities 2,776 – – – –
Total financial liabilities 7,115 236 – – –
Measurement of financial instruments at fair value is based on a three-level hierarchy and on the
proximity of the measurement factors used to an active market. An active market is one in which
homogenous products are traded, where willing buyers and sellers can be found for them at all
times, and where their prices are publicly available.
Level 1 involves the measurement of financial instruments, such as securities and cash and cash
equivalents listed on active markets.
Level 2 involves the measurement of financial instruments such as derivatives based on market-
related, recognized financial valuation models, where the measurement factors, such as ex-
change rates or interest rates, can be observed directly or indirectly on active markets.
In the Audi Group, level 3 mainly covers residual value hedging arrangements with the retail
trade. The input factors for measuring the future development of used car prices cannot be
observed on active markets; they are forecasted by various independent institutions. The resid-
ual value hedging model is explained in Note 34.3, “Market risks.”
Furthermore, non-current commodity futures are also measured according to level 3, as the key
parameters for their measurement cannot be observed on active markets owing to the long-
term nature of the contracts, but are extrapolated.