Audi 2009 Annual Report Download - page 215
Download and view the complete annual report
Please find page 215 of the 2009 Audi annual report below. You can navigate through the pages in the report by either clicking on the pages listed below, or by using the keyword search tool below to find specific information within the annual report.-
 1
1 -
2
-
3
-
4
-
5
-
6
-
7
-
8
-
9
-
10
-
11
-
12
-
13
-
14
-
15
-
16
-
17
-
18
-
19
-
20
-
21
-
22
-
23
-
24
-
25
-
26
-
27
-
28
-
29
-
30
-
31
-
32
-
33
-
34
-
35
-
36
-
37
-
38
-
39
-
40
-
41
-
42
-
43
-
44
-
45
-
46
-
47
-
48
-
49
-
50
-
51
-
52
-
53
-
54
-
55
-
56
-
57
-
58
-
59
-
60
-
61
-
62
-
63
-
64
-
65
-
66
-
67
-
68
-
69
-
70
-
71
-
72
-
73
-
74
-
75
-
76
-
77
-
78
-
79
-
80
-
81
-
82
-
83
-
84
-
85
-
86
-
87
-
88
-
89
-
90
-
91
-
92
-
93
-
94
-
95
-
96
-
97
-
98
-
99
-
100
-
101
-
102
-
103
-
104
-
105
-
106
-
107
-
108
-
109
-
110
-
111
-
112
-
113
-
114
-
115
-
116
-
117
-
118
-
119
-
120
-
121
-
122
-
123
-
124
-
125
-
126
-
127
-
128
-
129
-
130
-
131
-
132
-
133
-
134
-
135
-
136
-
137
-
138
-
139
-
140
-
141
-
142
-
143
-
144
-
145
-
146
-
147
-
148
-
149
-
150
-
151
-
152
-
153
-
154
-
155
-
156
-
157
-
158
-
159
-
160
-
161
-
162
-
163
-
164
-
165
-
166
-
167
-
168
-
169
-
170
-
171
-
172
-
173
-
174
-
175
-
176
-
177
-
178
-
179
-
180
-
181
-
182
-
183
-
184
-
185
-
186
-
187
-
188
-
189
-
190
-
191
-
192
-
193
-
194
-
195
-
196
-
197
-
198
-
199
-
200
-
201
-
202
-
203
-
204
-
 205
205 -
 206
206 -
 207
207 -
 208
208 -
 209
209 -
 210
210 -
 211
211 -
 212
212 -
 213
213 -
 214
214 -
 215
215 -
 216
216 -
 217
217 -
 218
218 -
 219
219 -
 220
220 -
 221
221 -
 222
222 -
 223
223 -
 224
224 -
 225
225 -
226
-
227
-
228
-
229
-
230
-
231
-
232
-
233
-
234
-
235
-
236
-
237
-
238
-
239
-
240
-
241
-
242
-
243
-
244
-
245
-
246
-
247
-
248
-
249
-
250
-
251
-
252
 |
 |

212
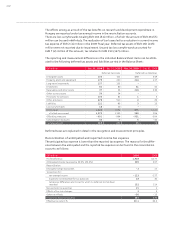
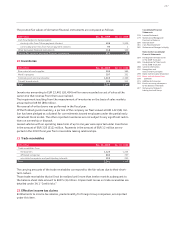
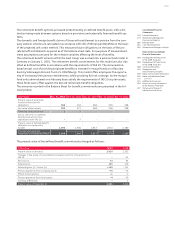
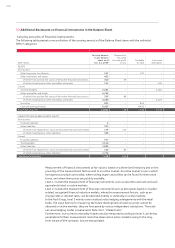
The reconciliation for the fair value of the plan assets is as follows:
EUR million 2009 2008
Plan assets on January 1 471 368
Changes in the group of consolidated companies and first-time adoption of IAS 19 – 86
Expected return on plan assets 24 23
Actuarial gains (+) / losses (–) + 36 – 47
Employer contributions 64 59
Benefits paid – 4 – 19
Effects of transfers – 1
Other reconciliation effects – 7 –
Plan assets on December 31 583 471
In the past fiscal year, actual gains from the plan assets amounted to EUR 53 million.
The long-term overall yield on the plan assets is determined on a uniform basis and depends on
the actual long-term earnings of the portfolio, historical overall market yields, and a forecast of
the anticipated yields of the classes of security in the portfolio.
Employer contributions to the fund assets totaling EUR 65 (60) million are expected for the
following fiscal year.
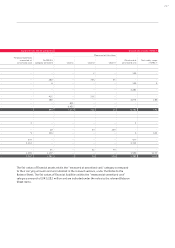
The composition of fund assets is as follows, by category:
% of fund assets 2009 2008
Shares 31.1 13.9
Fixed-income securities 42.8 45.0
Cash 7.4 25.2
Real estate 3.3 –
Other 15.5 15.9
100.0 100.0
Actuarial gains and losses result from changes in the entitlement base and from deviations in
the actual trends (e.g. increases in pay or retirement benefits) from the figures assumed for
calculation purposes. In accordance with the requirements of IAS 19, such gains and losses are
recognized without affecting income under a separate line item within equity, taking deferred
tax into account.
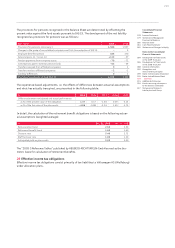
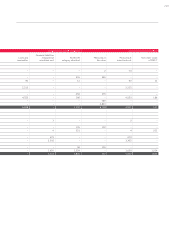
The following amounts were recognized in the Income Statement:
EUR million 2009 2008
Current service cost for services provided by the employees in the fiscal year – 74 – 64
Interest cost – 135 – 129
Expected return on plan assets 24 23
Currency differences due to foreign employee benefit plans – –
Total – 185 – 170
The interest element in pension costs is shown under financing costs. The expected return on
plan assets is also shown under this item.