Audi 2009 Annual Report Download - page 228
Download and view the complete annual report
Please find page 228 of the 2009 Audi annual report below. You can navigate through the pages in the report by either clicking on the pages listed below, or by using the keyword search tool below to find specific information within the annual report.-
 1
1 -
2
-
3
-
4
-
5
-
6
-
7
-
8
-
9
-
10
-
11
-
12
-
13
-
14
-
15
-
16
-
17
-
18
-
19
-
20
-
21
-
22
-
23
-
24
-
25
-
26
-
27
-
28
-
29
-
30
-
31
-
32
-
33
-
34
-
35
-
36
-
37
-
38
-
39
-
40
-
41
-
42
-
43
-
44
-
45
-
46
-
47
-
48
-
49
-
50
-
51
-
52
-
53
-
54
-
55
-
56
-
57
-
58
-
59
-
60
-
61
-
62
-
63
-
64
-
65
-
66
-
67
-
68
-
69
-
70
-
71
-
72
-
73
-
74
-
75
-
76
-
77
-
78
-
79
-
80
-
81
-
82
-
83
-
84
-
85
-
86
-
87
-
88
-
89
-
90
-
91
-
92
-
93
-
94
-
95
-
96
-
97
-
98
-
99
-
100
-
101
-
102
-
103
-
104
-
105
-
106
-
107
-
108
-
109
-
110
-
111
-
112
-
113
-
114
-
115
-
116
-
117
-
118
-
119
-
120
-
121
-
122
-
123
-
124
-
125
-
126
-
127
-
128
-
129
-
130
-
131
-
132
-
133
-
134
-
135
-
136
-
137
-
138
-
139
-
140
-
141
-
142
-
143
-
144
-
145
-
146
-
147
-
148
-
149
-
150
-
151
-
152
-
153
-
154
-
155
-
156
-
157
-
158
-
159
-
160
-
161
-
162
-
163
-
164
-
165
-
166
-
167
-
168
-
169
-
170
-
171
-
172
-
173
-
174
-
175
-
176
-
177
-
178
-
179
-
180
-
181
-
182
-
183
-
184
-
185
-
186
-
187
-
188
-
189
-
190
-
191
-
192
-
193
-
194
-
195
-
196
-
197
-
198
-
199
-
200
-
201
-
202
-
203
-
204
-
205
-
206
-
207
-
208
-
209
-
210
-
211
-
212
-
213
-
214
-
215
-
216
-
217
-
 218
218 -
 219
219 -
 220
220 -
 221
221 -
 222
222 -
 223
223 -
 224
224 -
 225
225 -
 226
226 -
 227
227 -
 228
228 -
 229
229 -
 230
230 -
 231
231 -
 232
232 -
 233
233 -
 234
234 -
 235
235 -
 236
236 -
 237
237 -
 238
238 -
239
-
240
-
241
-
242
-
243
-
244
-
245
-
246
-
247
-
248
-
249
-
250
-
251
-
252
 |
 |

225
Consolidated Financial
Statements
178 Income Statement
179 Statement of Recognized
Income and Expense
180 Balance Sheet
181 Cash Flow Statement
182 Statement of Changes in Equity
Notes to the Consolidated
Financial Statements
184 Development of fixed assets
in the 2009 fiscal year
186 Development of fixed assets
in the 2008 fiscal year
188 General information
192 Recognition and
measurement principles
199 Notes to the Income Statement
205 Notes to the Balance Sheet
215 Additional disclosures
236 Events occurring subsequent
to the balance sheet date
237 Statement of Interests
held by the Audi Group
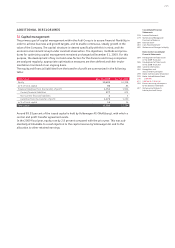
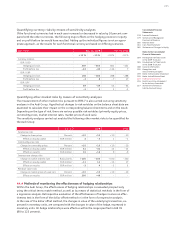
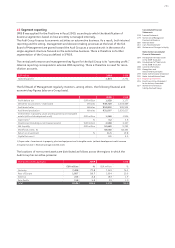
Quantifying currency risks by means of sensitivity analyses
If the functional currencies had in each case increased or decreased in value by 10 percent com-
pared with the other currencies, the following major effects on the hedging provision in equity
and on profit before tax would have resulted. Adding up the individual figures is not an appro-
priate approach, as the results for each functional currency are based on differing scenarios.
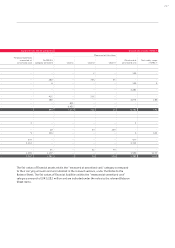
EUR million Dec. 31, 2009 Dec. 31, 2008
+ 10 % – 10 % + 10 % – 10 %
Currency relation
EUR / USD
Hedging provision 487 – 365 662 – 421
Profit before tax – 24 – 40 – 134 7
EUR / GBP
Hedging provision 184 – 182 288 – 288
Profit before tax – 3 8 – 717
EUR / JPY
Hedging provision 49 – 49 54 – 54
Profit before tax – 2 2 2 – 2
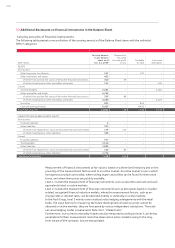
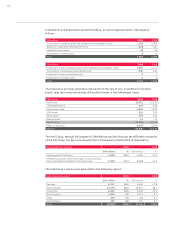
Quantifying other market risks by means of sensitivity analyses
The measurement of other market risks pursuant to IFRS 7 is also carried out using sensitivity
analyses in the Audi Group. Hypothetical changes to risk variables on the balance sheet date are
examined to calculate their impact on the corresponding balance sheet items and on the result.
Depending on the type of risk, there are various possible risk variables (primarily equity prices,
commodity prices, market interest rates, market prices of used cars).
The sensitivity analyses carried out enabled the following other market risks to be quantified for
the Audi Group:
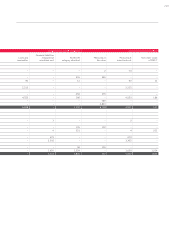
Data in 2009 2008
Fund price risks
Change in share prices Percent + 10 – 10 + 10 – 10
Effects on equity capital EUR million 4 – 41 – 1
Commodity price risks
Change in commodity prices Percent + 10 – 10 + 10 – 10
Effects on equity capital EUR million 41 – 41 15 – 15
Effects on results EUR million 16 – 16 9 – 9
Interest rate change risks
Change in market interest rate Basis points + 100 – 100 + 100 – 100
Effects on equity capital EUR million – 11 12 – 15 17
Effects on results EUR million – 3 4 – 33
Residual value risks
Change in market prices of used cars Percent + 10 – 10 + 10 – 10
Effects on results EUR million 200 – 46 ––
34.4 Methods of monitoring the effectiveness of hedging relationships
Within the Audi Group, the effectiveness of hedging relationships is evaluated prospectively
using the critical terms match method, as well as by means of statistical methods in the form of
a regression analysis. Retrospective evaluation of the effectiveness of hedges involves an effec-
tiveness test in the form of the dollar offset method or in the form of a regression analysis.
In the case of the dollar offset method, the changes in value of the underlying transaction, ex-
pressed in monetary units, are compared with the changes in value of the hedge, expressed in
monetary units. All hedge relationships were effective within the range specified in IAS 39
(80 to 125 percent).