Audi 2009 Annual Report Download - page 224
Download and view the complete annual report
Please find page 224 of the 2009 Audi annual report below. You can navigate through the pages in the report by either clicking on the pages listed below, or by using the keyword search tool below to find specific information within the annual report.-
 1
1 -
2
-
3
-
4
-
5
-
6
-
7
-
8
-
9
-
10
-
11
-
12
-
13
-
14
-
15
-
16
-
17
-
18
-
19
-
20
-
21
-
22
-
23
-
24
-
25
-
26
-
27
-
28
-
29
-
30
-
31
-
32
-
33
-
34
-
35
-
36
-
37
-
38
-
39
-
40
-
41
-
42
-
43
-
44
-
45
-
46
-
47
-
48
-
49
-
50
-
51
-
52
-
53
-
54
-
55
-
56
-
57
-
58
-
59
-
60
-
61
-
62
-
63
-
64
-
65
-
66
-
67
-
68
-
69
-
70
-
71
-
72
-
73
-
74
-
75
-
76
-
77
-
78
-
79
-
80
-
81
-
82
-
83
-
84
-
85
-
86
-
87
-
88
-
89
-
90
-
91
-
92
-
93
-
94
-
95
-
96
-
97
-
98
-
99
-
100
-
101
-
102
-
103
-
104
-
105
-
106
-
107
-
108
-
109
-
110
-
111
-
112
-
113
-
114
-
115
-
116
-
117
-
118
-
119
-
120
-
121
-
122
-
123
-
124
-
125
-
126
-
127
-
128
-
129
-
130
-
131
-
132
-
133
-
134
-
135
-
136
-
137
-
138
-
139
-
140
-
141
-
142
-
143
-
144
-
145
-
146
-
147
-
148
-
149
-
150
-
151
-
152
-
153
-
154
-
155
-
156
-
157
-
158
-
159
-
160
-
161
-
162
-
163
-
164
-
165
-
166
-
167
-
168
-
169
-
170
-
171
-
172
-
173
-
174
-
175
-
176
-
177
-
178
-
179
-
180
-
181
-
182
-
183
-
184
-
185
-
186
-
187
-
188
-
189
-
190
-
191
-
192
-
193
-
194
-
195
-
196
-
197
-
198
-
199
-
200
-
201
-
202
-
203
-
204
-
205
-
206
-
207
-
208
-
209
-
210
-
211
-
212
-
213
-
 214
214 -
 215
215 -
 216
216 -
 217
217 -
 218
218 -
 219
219 -
 220
220 -
 221
221 -
 222
222 -
 223
223 -
 224
224 -
 225
225 -
 226
226 -
 227
227 -
 228
228 -
 229
229 -
 230
230 -
 231
231 -
 232
232 -
 233
233 -
 234
234 -
235
-
236
-
237
-
238
-
239
-
240
-
241
-
242
-
243
-
244
-
245
-
246
-
247
-
248
-
249
-
250
-
251
-
252
 |
 |

221
Consolidated Financial
Statements
178 Income Statement
179 Statement of Recognized
Income and Expense
180 Balance Sheet
181 Cash Flow Statement
182 Statement of Changes in Equity
Notes to the Consolidated
Financial Statements
184 Development of fixed assets
in the 2009 fiscal year
186 Development of fixed assets
in the 2008 fiscal year
188 General information
192 Recognition and
measurement principles
199 Notes to the Income Statement
205 Notes to the Balance Sheet
215 Additional disclosures
236 Events occurring subsequent
to the balance sheet date
237 Statement of Interests
held by the Audi Group
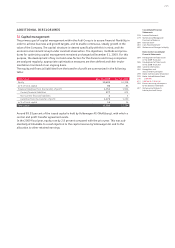
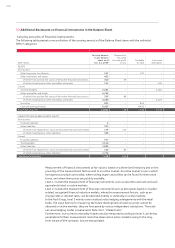
EUR million
Gross carrying
amount as of
Dec. 31, 2008
Neither past
due nor
impaired Past due and
not impaired Impaired
Measured at amortized cost
Trade receivables 2,247 1,490 687 70
Other receivables 4,648 4,582 50 16
of which receivables from loans 4,344 4,343 01
of which miscellaneous receivables 304 239 50 15
Total 6,895 6,072 737 86
The Audi Group’s trading partners, borrowers and debtors are regularly monitored under the risk
management system. All receivables that are “neither past due nor impaired,” amounting to
EUR 6,121 (7,217) million, are allocable to risk category 1. Risk category 1 is the highest
rating category within the Volkswagen Group; it exclusively comprises “customers of high
creditworthiness.”
Within the Audi Group, there are absolutely no past due financial instruments measured at fair
value. The fair values of these financial instruments are determined based on their market
prices. Due to the fluctuations in market value precipitated by the financial crisis, individual bad
debt allowances were made in fiscal 2009 for securities measured at fair value, encompassing
costs of purchase of EUR 18 (83) million.
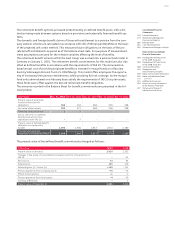
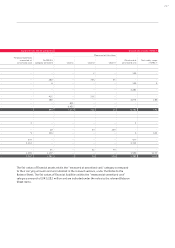
Financial assets that are past due and not impaired are presented in the following analysis by
maturity dates of gross carrying amounts:
EUR million Past due and
not impaired Past due
Dec. 31, 2009 Up to 30 days 30 to 90 days More than
90 days
Measured at amortized cost
Trade receivables 573 265 256 51
Other receivables 43 22 19 2
of which receivables from loans 00 – –
of which miscellaneous receivables 42 21 19 2
Total 615 287 275 53
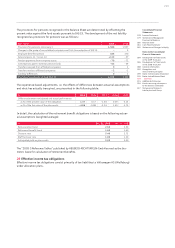
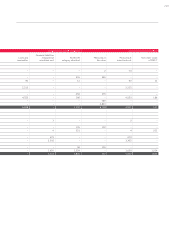
EUR million Past due and
not impaired Past due
Dec. 31, 2008 Up to 30 days 30 to 90 days More than
90 days
Measured at amortized cost
Trade receivables 687 493 134 60
Other receivables 50 40 73
of which receivables from loans 0 0 – –
of which miscellaneous receivables 50 40 73
Total 737 533 141 63
The credit risk is low overall, as the vast majority of the past due and not impaired financial assets
are past due by only a short period – predominantly due to the customer’s purchase invoice and
payment processes. It was therefore not necessary to implement any contractual changes to
prevent financial instruments from becoming past due.