Audi 2009 Annual Report Download - page 229
Download and view the complete annual report
Please find page 229 of the 2009 Audi annual report below. You can navigate through the pages in the report by either clicking on the pages listed below, or by using the keyword search tool below to find specific information within the annual report.-
 1
1 -
2
-
3
-
4
-
5
-
6
-
7
-
8
-
9
-
10
-
11
-
12
-
13
-
14
-
15
-
16
-
17
-
18
-
19
-
20
-
21
-
22
-
23
-
24
-
25
-
26
-
27
-
28
-
29
-
30
-
31
-
32
-
33
-
34
-
35
-
36
-
37
-
38
-
39
-
40
-
41
-
42
-
43
-
44
-
45
-
46
-
47
-
48
-
49
-
50
-
51
-
52
-
53
-
54
-
55
-
56
-
57
-
58
-
59
-
60
-
61
-
62
-
63
-
64
-
65
-
66
-
67
-
68
-
69
-
70
-
71
-
72
-
73
-
74
-
75
-
76
-
77
-
78
-
79
-
80
-
81
-
82
-
83
-
84
-
85
-
86
-
87
-
88
-
89
-
90
-
91
-
92
-
93
-
94
-
95
-
96
-
97
-
98
-
99
-
100
-
101
-
102
-
103
-
104
-
105
-
106
-
107
-
108
-
109
-
110
-
111
-
112
-
113
-
114
-
115
-
116
-
117
-
118
-
119
-
120
-
121
-
122
-
123
-
124
-
125
-
126
-
127
-
128
-
129
-
130
-
131
-
132
-
133
-
134
-
135
-
136
-
137
-
138
-
139
-
140
-
141
-
142
-
143
-
144
-
145
-
146
-
147
-
148
-
149
-
150
-
151
-
152
-
153
-
154
-
155
-
156
-
157
-
158
-
159
-
160
-
161
-
162
-
163
-
164
-
165
-
166
-
167
-
168
-
169
-
170
-
171
-
172
-
173
-
174
-
175
-
176
-
177
-
178
-
179
-
180
-
181
-
182
-
183
-
184
-
185
-
186
-
187
-
188
-
189
-
190
-
191
-
192
-
193
-
194
-
195
-
196
-
197
-
198
-
199
-
200
-
201
-
202
-
203
-
204
-
205
-
206
-
207
-
208
-
209
-
210
-
211
-
212
-
213
-
214
-
215
-
216
-
217
-
218
-
 219
219 -
 220
220 -
 221
221 -
 222
222 -
 223
223 -
 224
224 -
 225
225 -
 226
226 -
 227
227 -
 228
228 -
 229
229 -
 230
230 -
 231
231 -
 232
232 -
 233
233 -
 234
234 -
 235
235 -
 236
236 -
 237
237 -
 238
238 -
 239
239 -
240
-
241
-
242
-
243
-
244
-
245
-
246
-
247
-
248
-
249
-
250
-
251
-
252
 |
 |
226
In the case of regression analysis, the performance of the underlying transaction is viewed as an
independent variable, while that of the hedging transaction is regarded as a dependent variable.
The transaction is classed as effective hedging if the coefficients of determination and escala-
tion factors are appropriate. All of the hedging relationships verified using this statistical
method proved to be effective on the year-end date.
In 2009, there was one-off ineffectiveness resulting from cash flow hedges amounting to
EUR 3 (0) million.
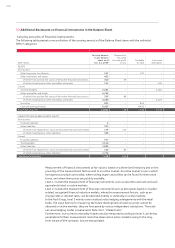
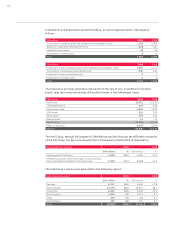
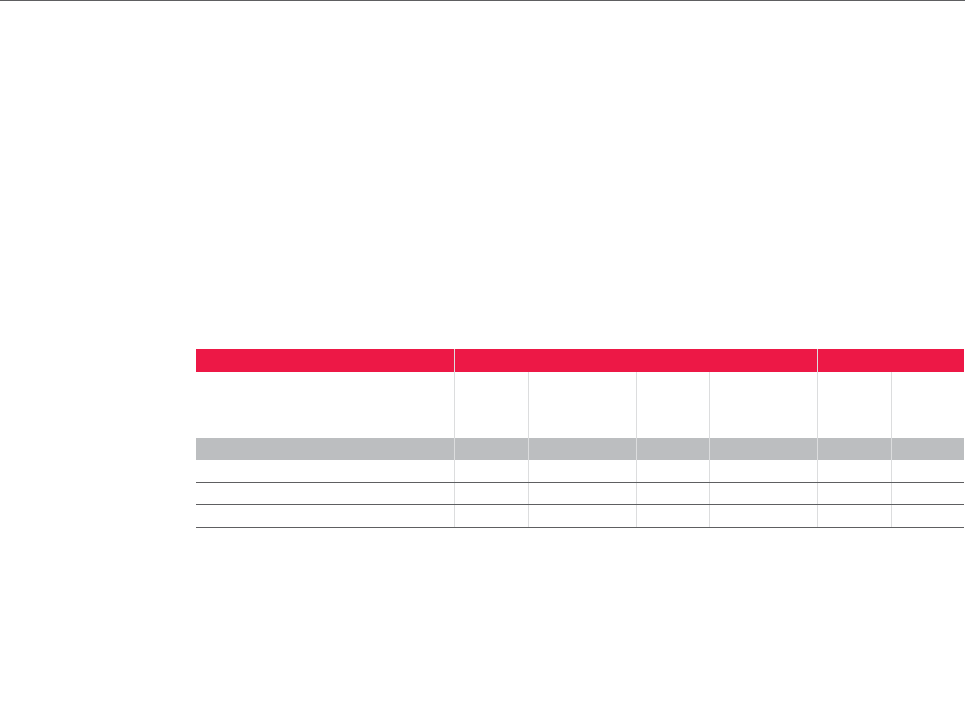
Nominal volume of derivative financial instruments
The nominal volumes of the presented cash flow hedges for hedging currency risks and com-
modity price risks represent the total of all buying and selling prices on which the transactions
are based.
EUR million Nominal volumes Fair values
Dec. 31,
2009
Residual time
to maturity
up to 1 year Dec. 31,
2008
Residual time
to maturity
up to 1 year Dec. 31,
2009 Dec. 31,
2008
Cash flow hedges 9,289 4,472 12,805 5,266 634 810
Foreign exchange contracts 7,143 4,198 7,588 5,185 530 570
Currency option transactions 1,806 189 4,980 – 15 309
Commodity futures 340 85 237 81 89 – 69
Other derivative financial instruments
The derivative financial instruments used exhibit a maximum hedging term of seven years. The
other derivative financial instruments primarily include ineffective contracts to hedge market
risks and a contract containing the right to acquire shares in a company. The market values of
these derivatives amount to EUR – 117 (82) million.
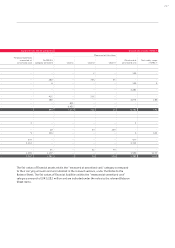
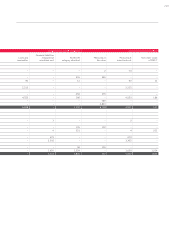
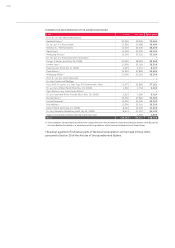
35 Cash Flow Statement
The Cash Flow Statement details the payment streams for both the 2009 fiscal year and the
previous year, categorized according to cash used and received for operating, investing and fi-
nancing activities. The effects of changes in the group of consolidated companies and to foreign
exchange rates on cash flows are presented separately.
Cash flow from operating activities includes all payment streams in connection with ordinary
activities and is presented using the indirect calculation method. Starting from the profit before
profit transfer and tax, all income and expenses with no impact on cash flow (mainly write-
downs) are excluded.
In 2009, cash flow from operating activities included payments for interest received amounting
to EUR 292 (400) million and for interest paid amounting to EUR 25 (95) million. The Audi
Group received dividends and profit transfers totaling EUR 91 (71) million in 2009 . The income
tax payments item substantially comprises payments made to Volkswagen AG (Wolfsburg) on
the basis of the single-entity relationship for tax purposes in Germany, as well as payments to
foreign tax authorities.
Cash flow from investing activities includes capitalized development costs as well as additions
to other intangible assets, property, plant and equipment, long-term investments and non-
current loans extended. The proceeds from the disposal of assets, the proceeds from the sale of
shares, and the change in securities effective as payment are similarly reported in cash flow
from investing activities. The sale of shares in Volkswagen Group Singapore Pte. Ltd. (Singapore)
generated cash of EUR 2 million in 2009. The sale in 2008 of AUDI DO BRASIL E CIA. (Curitiba,
Brazil) generated cash of EUR 101 million.