Advance Auto Parts 2007 Annual Report Download - page 93
Download and view the complete annual report
Please find page 93 of the 2007 Advance Auto Parts annual report below. You can navigate through the pages in the report by either clicking on the pages listed below, or by using the keyword search tool below to find specific information within the annual report.-
 1
1 -
2
-
3
-
4
-
5
-
6
-
7
-
8
-
9
-
10
-
11
-
12
-
13
-
14
-
15
-
16
-
17
-
18
-
19
-
20
-
21
-
22
-
23
-
24
-
25
-
26
-
27
-
28
-
29
-
30
-
31
-
32
-
33
-
34
-
35
-
36
-
37
-
38
-
39
-
40
-
41
-
42
-
43
-
44
-
45
-
46
-
47
-
48
-
49
-
50
-
51
-
52
-
53
-
54
-
55
-
56
-
57
-
58
-
59
-
60
-
61
-
62
-
63
-
64
-
65
-
66
-
67
-
68
-
69
-
70
-
71
-
72
-
73
-
74
-
75
-
76
-
77
-
78
-
79
-
80
-
81
-
82
-
 83
83 -
 84
84 -
 85
85 -
 86
86 -
 87
87 -
 88
88 -
 89
89 -
 90
90 -
 91
91 -
 92
92 -
 93
93 -
 94
94 -
 95
95 -
 96
96 -
 97
97 -
 98
98 -
 99
99 -
 100
100 -
 101
101 -
 102
102 -
 103
103 -
104
-
105
-
106
-
107
-
108
-
109
 |
 |
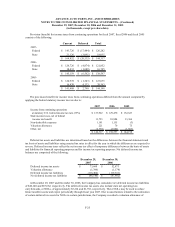
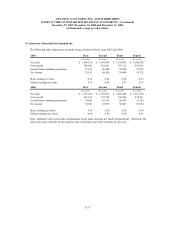
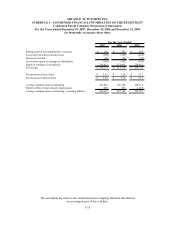
ADVANCE AUTO PARTS, INC. AND SUBSIDIARIES
NOTES TO THE CONSOLIDATED FINANCIAL STATEMENTS – (Continued)
December 29, 2007, December 30, 2006 and December 31, 2005
(in thousands, except per share data)
2007 2006 2005
Net Sales
AAP 4,709,390$ 4,505,437$ 4,234,667$
AI 135,014 111,066 30,304
Total Net Sales 4,844,404$ 4,616,503$ 4,264,971$
Percentage of Sales, by Product Group
in AAP Segment (1)
Parts 57% 57% 61%
Accessories 18% 18% 15%
Chemicals 12% 12% 12%
Oil 9% 9% 7%
Other 4% 4% 5%
Total 100% 100% 100%
Income (loss) before provision (benefit) for
income taxes
AAP 383,392$ 368,818$ 377,205$
AI (758) 1,097 1,718
Total income (loss) before provision (benefit) for
income taxes 382,634$ 369,915$ 378,923$
Provision
(
benefit
)
for income taxes
AAP 144,579$ 138,144$ 143,514$
AI (262) 453 684
Total provision (benefit) for income taxes 144,317$ 138,597$ 144,198$
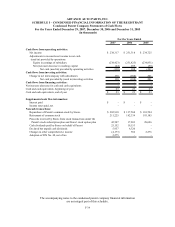
Segment assets
AAP 2,663,791$ 2,565,986$ 2,446,226$
AI 141,775 116,695 95,923
Total segment assets 2,805,566$ 2,682,681$ 2,542,149$
Depreciation and amortization
AAP 142,194$ 135,159$ 119,184$
AI 5,070 4,264 754
Total depreciation and amortization 147,264$ 139,423$ 119,938$
Capital expenditures
AAP 203,486$ 251,024$ 215,585$
AI 7,114 7,562 629
Total capital expenditures 210,600$ 258,586$ 216,214$
(1) – Sales by product group are not available for the AI segment.
F-34