Advance Auto Parts 2007 Annual Report Download - page 43
Download and view the complete annual report
Please find page 43 of the 2007 Advance Auto Parts annual report below. You can navigate through the pages in the report by either clicking on the pages listed below, or by using the keyword search tool below to find specific information within the annual report.-
 1
1 -
2
-
3
-
4
-
5
-
6
-
7
-
8
-
9
-
10
-
11
-
12
-
13
-
14
-
15
-
16
-
17
-
18
-
19
-
20
-
21
-
22
-
23
-
24
-
25
-
26
-
27
-
28
-
29
-
30
-
31
-
32
-
 33
33 -
 34
34 -
 35
35 -
 36
36 -
 37
37 -
 38
38 -
 39
39 -
 40
40 -
 41
41 -
 42
42 -
 43
43 -
 44
44 -
 45
45 -
 46
46 -
 47
47 -
 48
48 -
 49
49 -
 50
50 -
 51
51 -
 52
52 -
 53
53 -
54
-
55
-
56
-
57
-
58
-
59
-
60
-
61
-
62
-
63
-
64
-
65
-
66
-
67
-
68
-
69
-
70
-
71
-
72
-
73
-
74
-
75
-
76
-
77
-
78
-
79
-
80
-
81
-
82
-
83
-
84
-
85
-
86
-
87
-
88
-
89
-
90
-
91
-
92
-
93
-
94
-
95
-
96
-
97
-
98
-
99
-
100
-
101
-
102
-
103
-
104
-
105
-
106
-
107
-
108
-
109
 |
 |

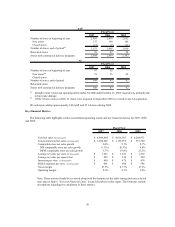
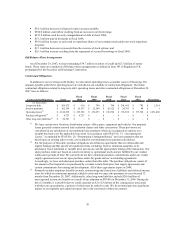
2007 2006 2005
Number of stores at beginning of year 2,995 2,810 2,652
New stores 175 190 169
Closed stores (17) (5) (11)
Number of stores, end of period
(a)
3,153 2,995 2,810
Relocated stores 29 47 54
Stores with commercial delivery programs 2,604 2,439 2,192
2007 2006 2005
Number of stores at beginning of year 87 62 -
New stores
(b)
21 25 62
Closed stores - - -
Number of stores, end of period 108 87 62
Relocated stores - - -
Stores with commercial delivery programs 108 87 62
AAP
Fiscal Year
Fiscal Year
AI
(a) Includes 2 and 7 stores not operating at December 30, 2006 and December 31, 2005, respectively, primarily due
to hurricane damage.
(b) Of the 62 new stores in 2005, 61 stores were acquired in September 2005 as a result of our AI acquisition.
We anticipate adding approximately 100 AAP and 15 AI stores during 2008.
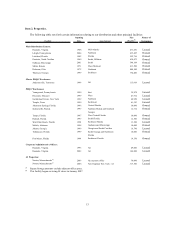
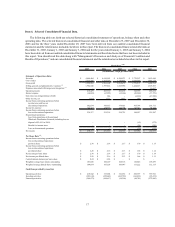
Key Financial Metrics
The following table highlights certain consolidated operating results and key financial metrics for 2007, 2006
and 2005:
2007 2006 2005
Total net sales
(in thousands)
4,844,404$ 4,616,503$ 4,264,971$
Total commercial net sales
(in thousands)
1,290,602$ 1,155,953$ 931,320$
Comparable store net sales growth 0.8% 2.1% 8.7%
DIY comparable store net sales growth (1.0%) (0.3%) 4.8%
DIFM comparable store net sales growth 6.7% 10.8% 25.2%
Average net sales per store
(in thousands)
1,527$ 1,551$ 1,555$
Average net sales per square foot 207$ 210$ 209$
Inventory per store
(in thousands)
469$ 475$ 476$
SG&A expenses per store
(in thousands)
601$ 604$ 586$
Gross margin 47.9% 47.7% 47.2%
Operating margin 8.6% 8.7% 9.6%
Fiscal Year
Note: These metrics should be reviewed along with the footnotes to the table setting forth our selected
store data in Item 6 “Selected Financial Data” located elsewhere in this report. The footnotes contain
descriptions regarding the calculation of these metrics.
20