Advance Auto Parts 2007 Annual Report Download - page 41
Download and view the complete annual report
Please find page 41 of the 2007 Advance Auto Parts annual report below. You can navigate through the pages in the report by either clicking on the pages listed below, or by using the keyword search tool below to find specific information within the annual report.-
 1
1 -
2
-
3
-
4
-
5
-
6
-
7
-
8
-
9
-
10
-
11
-
12
-
13
-
14
-
15
-
16
-
17
-
18
-
19
-
20
-
21
-
22
-
23
-
24
-
25
-
26
-
27
-
28
-
29
-
30
-
 31
31 -
 32
32 -
 33
33 -
 34
34 -
 35
35 -
 36
36 -
 37
37 -
 38
38 -
 39
39 -
 40
40 -
 41
41 -
 42
42 -
 43
43 -
 44
44 -
 45
45 -
 46
46 -
 47
47 -
 48
48 -
 49
49 -
 50
50 -
 51
51 -
52
-
53
-
54
-
55
-
56
-
57
-
58
-
59
-
60
-
61
-
62
-
63
-
64
-
65
-
66
-
67
-
68
-
69
-
70
-
71
-
72
-
73
-
74
-
75
-
76
-
77
-
78
-
79
-
80
-
81
-
82
-
83
-
84
-
85
-
86
-
87
-
88
-
89
-
90
-
91
-
92
-
93
-
94
-
95
-
96
-
97
-
98
-
99
-
100
-
101
-
102
-
103
-
104
-
105
-
106
-
107
-
108
-
109
 |
 |

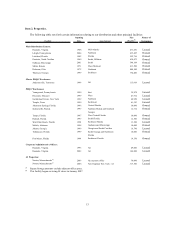
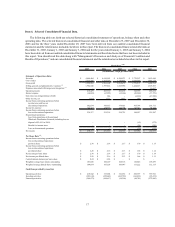
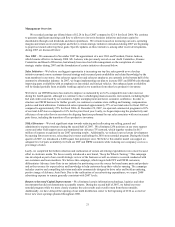
2007 2006 2005 2004 2003
Balance Sheet and Other Financial Data:
Cash and cash equivalents 14,654$ 11,128$ 40,783$ 56,321$ 11,487$
Inventor
y
1,529,469$ 1,463,340$ 1,367,099$ 1,201,450$ 1,113,781$
Inventory turnover
(6)
1.69 1.71 1.75 1.74 1.72
Inventory per store
(7)
469$ 475$ 476$ 453$ 439$
Accounts payable to inventory ratio
(8)
55.1% 53.2% 54.8% 53.7% 51.0%
Net working capital
(9)
456,897$ 498,553$ 406,476$ 416,302$ 372,509$
Capital expenditures 210,600$ 258,586$ 216,214$ 179,766$ 101,177$
Total assets 2,805,566$ 2,682,681$ 2,542,149$ 2,201,962$ 1,983,071$
Total debt 505,672$ 477,240$ 438,800$ 470,000$ 445,000$
Total net debt
(10)
521,018$ 500,318$ 448,187$ 433,863$ 464,598$
Total stockholders' equit
y
1,023,795$ 1,030,854$ 919,771$ 722,315$ 631,244$
Selected Store Data:
Comparable store sales growth
(11)
0.8% 2.1% 8.7% 6.1% 3.1%
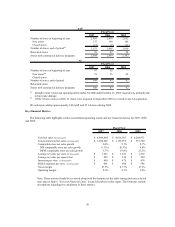
Number of stores at beginning of year 3,082 2,872 2,652 2,539 2,435
New stores 196 215 231 125 125
Closed stores (17) (5) (11) (12) (21)
Number of stores, end of period 3,261 3,082 2,872 2,652 2,539
Relocated stores 29 47 54 34 32
Stores with commercial delivery program, end of period 2,712 2,526 2,254 1,945 1,625
Total commercial sales, as a percentage of total sales 26.6% 25.0% 21.8% 18.4% 15.8%
SG&A expenses per store (in thousands)
(12)(13)
601$ 604$ 586$ 549$ 525$
Total store square footage, end of period 23,982 22,753 21,246 19,734 18,875
Average net sales per store (in thousands)
(13)(14)
1,527$ 1,551$ 1,555$ 1,453$ 1,379$
Average net sales per square foot
(13)(15)
207$ 210$ 209$ 195$ 186$
Fiscal Year
(1)(2)
(in thousands, except per share data and ratios)
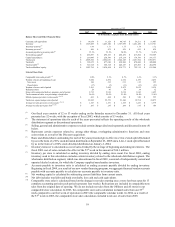
(1) Our fiscal year consists of 52 or 53 weeks ending on the Saturday nearest to December 31. All fiscal years
presented are 52 weeks, with the exception of fiscal 2003, which consists of 53 weeks.
(2) The statement of operations data for each of the years presented reflects the operating results of the wholesale
distribution segment as discontinued operations.
(3) Selling, general and administrative expenses exclude certain charges disclosed separately and discussed in note (4)
below.
(4) Represents certain expenses related to, among other things, overlapping administrative functions and store
conversions as a result of the Discount acquisition.
(5) Basic and diluted shares outstanding for each of the years presented gives effect to a 3-for-2 stock split effectuated
by us in the form of a 50% stock dividend distributed on September 23, 2005 and a 2-for-1 stock split effectuated
by us in the form of a 100% stock dividend distributed on January 2, 2004.
(6) Inventory turnover is calculated as cost of sales divided by the average of beginning and ending inventories. The
fiscal 2003 cost of sales excludes the effect of the 53rd week in the amount of $34.3 million.
(7) Inventory per store is calculated as ending inventory divided by ending store count. For fiscal 2003, ending
inventory used in this calculation excludes certain inventory related to the wholesale distribution segment. The
wholesales distribution segment, which was discontinued in fiscal 2003, consisted of independently owned and
operated dealer locations, for which the Company supplied merchandise inventory.
(8) Accounts payable to inventory ratio is calculated as ending accounts payable divided by ending inventory.
Beginning in fiscal 2004, as a result of our new vendor financing program, we aggregate financed vendor accounts
payable with accounts payable to calculate our accounts payable to inventory ratio.
(9) Net working capital is calculated by subtracting current liabilities from current assets.
(10) Net debt includes total debt and bank overdrafts, less cash and cash equivalents.
(11) Comparable store sales is calculated based on the change in net sales starting once a store has been open for 13
complete accounting periods (each period represents four weeks). Relocations are included in comparable store
sales from the original date of opening. We do not include net sales from the Offshore and AI stores in our
comparable store calculation. In 2003, the comparable store sales calculation included sales from our 53rd
week compared to our first week of operation in 2003 (the comparable calendar week). In 2004, as a result of
the 53rd week in 2003, the comparable store sales calculation excluded week one of sales from 2003.
18