Advance Auto Parts 2007 Annual Report Download - page 79
Download and view the complete annual report
Please find page 79 of the 2007 Advance Auto Parts annual report below. You can navigate through the pages in the report by either clicking on the pages listed below, or by using the keyword search tool below to find specific information within the annual report.-
 1
1 -
2
-
3
-
4
-
5
-
6
-
7
-
8
-
9
-
10
-
11
-
12
-
13
-
14
-
15
-
16
-
17
-
18
-
19
-
20
-
21
-
22
-
23
-
24
-
25
-
26
-
27
-
28
-
29
-
30
-
31
-
32
-
33
-
34
-
35
-
36
-
37
-
38
-
39
-
40
-
41
-
42
-
43
-
44
-
45
-
46
-
47
-
48
-
49
-
50
-
51
-
52
-
53
-
54
-
55
-
56
-
57
-
58
-
59
-
60
-
61
-
62
-
63
-
64
-
65
-
66
-
67
-
68
-
 69
69 -
 70
70 -
 71
71 -
 72
72 -
 73
73 -
 74
74 -
 75
75 -
 76
76 -
 77
77 -
 78
78 -
 79
79 -
 80
80 -
 81
81 -
 82
82 -
 83
83 -
 84
84 -
 85
85 -
 86
86 -
 87
87 -
 88
88 -
 89
89 -
90
-
91
-
92
-
93
-
94
-
95
-
96
-
97
-
98
-
99
-
100
-
101
-
102
-
103
-
104
-
105
-
106
-
107
-
108
-
109
 |
 |

ADVANCE AUTO PARTS, INC. AND SUBSIDIARIES
NOTES TO THE CONSOLIDATED FINANCIAL STATEMENTS – (Continued)
December 29, 2007, December 30, 2006 and December 31, 2005
(in thousands, except per share data)
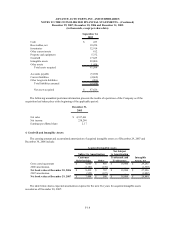
inventory at retail value and for damaged capital assets at replacement value. Accordingly, earnings for the years
ended December 29, 2007 and December 30, 2006 reflected $1,143 and $1,388 of insurance recoveries, net of
deductibles. During the year ended December 29, 2007, the Company collected the remainder of its receivable from
its insurance carrier related to previous catastrophic losses.
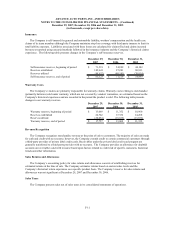
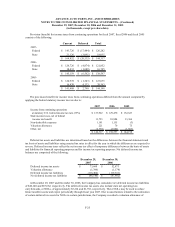
6. Receivables:
Receivables consist of the following:
December 29, December 30,
2007 2006
Trade 14,782$ 13,149$
Vendor 71,403 73,724
Insurance recover
y
- 9,676
Other 2,785 5,137
Total receivables 88,970 101,686
Less: Allowance for doubtful accounts (3,987) (4,640)
Receivables, net 84,983$ 97,046$
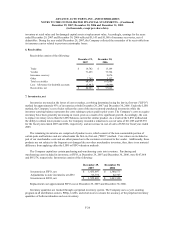
7. Inventories, net
Inventories are stated at the lower of cost or market, cost being determined using the last-in, first-out ("LIFO")
method for approximately 93% of inventories at both December 29, 2007 and December 30, 2006. Under the LIFO
method, the Company’s cost of sales reflects the costs of the most currently purchased inventories while the
inventory carrying balance represents the costs relating to prices paid in prior years. The Company’s costs to acquire
inventory have been generally decreasing in recent years as a result of its significant growth. Accordingly, the cost
to replace inventory is less than the LIFO balances carried for similar product. As a result of the LIFO method and
the ability to obtain lower product costs, the Company recorded a reduction to cost of sales of $11,005 and $9,978
for the fiscal years ended 2007 and 2006, respectively, and an increase in cost of sales of $526 for fiscal year ended
2005.
The remaining inventories are comprised of product cores, which consist of the non-consumable portion of
certain parts and batteries and are valued under the first-in, first-out ("FIFO") method. Core values are included as
part of our merchandise costs and are either passed on to the customer or returned to the vendor. Additionally, these
products are not subject to the frequent cost changes like our other merchandise inventory, thus, there is no material
difference from applying either the LIFO or FIFO valuation methods.
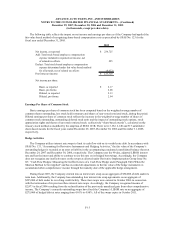
The Company capitalizes certain purchasing and warehousing costs into inventory. Purchasing and
warehousing costs included in inventory, at FIFO, at December 29, 2007 and December 30, 2006, were $107,068
and $95,576, respectively. Inventories consist of the following:
December 29, December 30,
2007 2006
Inventories at FIFO, net 1,435,697$ 1,380,573$
Adjustments to state inventories at LIFO 93,772 82,767
Inventories at LIFO, net 1,529,469$ 1,463,340$
Replacement cost approximated FIFO cost at December 29, 2007 and December 30, 2006.
Inventory quantities are tracked through a perpetual inventory system. The Company uses a cycle counting
program in all distribution centers, PDQs, LAWs, and retail stores to ensure the accuracy of the perpetual inventory
quantities of both merchandise and core inventory.
F-20