Advance Auto Parts 2007 Annual Report Download - page 39
Download and view the complete annual report
Please find page 39 of the 2007 Advance Auto Parts annual report below. You can navigate through the pages in the report by either clicking on the pages listed below, or by using the keyword search tool below to find specific information within the annual report.-
 1
1 -
2
-
3
-
4
-
5
-
6
-
7
-
8
-
9
-
10
-
11
-
12
-
13
-
14
-
15
-
16
-
17
-
18
-
19
-
20
-
21
-
22
-
23
-
24
-
25
-
26
-
27
-
28
-
 29
29 -
 30
30 -
 31
31 -
 32
32 -
 33
33 -
 34
34 -
 35
35 -
 36
36 -
 37
37 -
 38
38 -
 39
39 -
 40
40 -
 41
41 -
 42
42 -
 43
43 -
 44
44 -
 45
45 -
 46
46 -
 47
47 -
 48
48 -
 49
49 -
50
-
51
-
52
-
53
-
54
-
55
-
56
-
57
-
58
-
59
-
60
-
61
-
62
-
63
-
64
-
65
-
66
-
67
-
68
-
69
-
70
-
71
-
72
-
73
-
74
-
75
-
76
-
77
-
78
-
79
-
80
-
81
-
82
-
83
-
84
-
85
-
86
-
87
-
88
-
89
-
90
-
91
-
92
-
93
-
94
-
95
-
96
-
97
-
98
-
99
-
100
-
101
-
102
-
103
-
104
-
105
-
106
-
107
-
108
-
109
 |
 |

Number of shares to be
issued upon exercise of
outstanding options,
warrants, and rights
(1)
Weighted-average
exercise price of
outstanding options,
warrants, and rights
(2)
Number of securities
remaining available
for future issuance
under equity
compensation
plans
(1)(3)
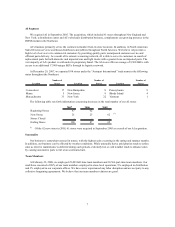
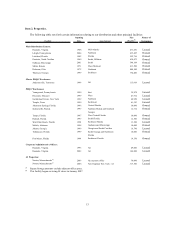
Equity compensation plans
approved by stockholders 6,097
(4)
$32.68 3,766
Equity compensation plans
not approved by stockholders - - -
Total 6,097 $32.68 3,766
(1) Number of shares presented is in thousands.
(2) Includes weighted average exercise price of outstanding stock options and stock appreciation rights, or SARs,
only.
(3) Excludes shares reflected in the first column.
(4) Includes grants of stock options, SARs, restricted stock and deferred stock units.
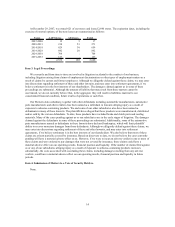
Stock Price Performance
The following graph shows a comparison of our cumulative total return on our common stock, the Standard &
Poor’s 500 Index and the Standard & Poor’s 500 Specialty Retail Index. The graph assumes that the value of an
investment in our common stock and in each such index was $100 on December 28, 2002, and that any dividends
have been reinvested. The comparison in the graph below is based solely on historical data and is not intended to
forecast the possible future performance of our common stock.
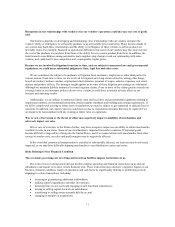
COMPARISON OF CUMULATIVE TOTAL RETURN AMONG
ADVANCE AUTO PARTS, INC., S&P 500 INDEX
AND S&P 500 SPECIALTY INDEX
Company / Index Dec 28, 2002 Jan 3, 2004 Jan 1, 2005 Dec 31, 2005 Dec 30, 2006 Dec 29, 2007
Advance Auto Parts 100 165.69 177.78 265.32 218.51 236.04
S&P 500 Index 100 128.93 143.41 150.45 174.21 185.06
S&P 500 Specialt
y
Retail Index 100 145.06 166.28 171.04 182.39 144.80
Comparison of Cumulative Five Year Total Return
$0
$50
$100
$150
$200
$250
$300
12/28/02 01/03/04 01/01/05 12/31/05 12/30/06 12/29/07
Advance Auto Parts S&P 500 Index S&P 500 Specialty Retail Index
16