Advance Auto Parts 2007 Annual Report Download - page 8
Download and view the complete annual report
Please find page 8 of the 2007 Advance Auto Parts annual report below. You can navigate through the pages in the report by either clicking on the pages listed below, or by using the keyword search tool below to find specific information within the annual report.-
 1
1 -
 2
2 -
 3
3 -
 4
4 -
 5
5 -
 6
6 -
 7
7 -
 8
8 -
 9
9 -
 10
10 -
 11
11 -
 12
12 -
 13
13 -
 14
14 -
 15
15 -
 16
16 -
 17
17 -
 18
18 -
 19
19 -
20
-
21
-
22
-
23
-
24
-
25
-
26
-
27
-
28
-
29
-
30
-
31
-
32
-
33
-
34
-
35
-
36
-
37
-
38
-
39
-
40
-
41
-
42
-
43
-
44
-
45
-
46
-
47
-
48
-
49
-
50
-
51
-
52
-
53
-
54
-
55
-
56
-
57
-
58
-
59
-
60
-
61
-
62
-
63
-
64
-
65
-
66
-
67
-
68
-
69
-
70
-
71
-
72
-
73
-
74
-
75
-
76
-
77
-
78
-
79
-
80
-
81
-
82
-
83
-
84
-
85
-
86
-
87
-
88
-
89
-
90
-
91
-
92
-
93
-
94
-
95
-
96
-
97
-
98
-
99
-
100
-
101
-
102
-
103
-
104
-
105
-
106
-
107
-
108
-
109
 |
 |

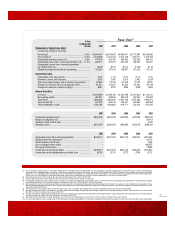
ADVANCE AUTO PARTS 2007 ANNUAL REPORT
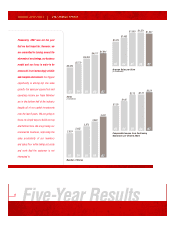
Five-Year Results
Financially, 2007 was not the year
that we had hoped for. However, we
are committed to turning around the
elements of our strategy, our business
model and our focus in order to be
successful in an increasingly volatile
and complex environment. Our biggest
opportunity is driving top line sales
growth. Our sales per square foot and
operating income per Team Member
are in the bottom half of the industry
despite all of our capital investments
over the last 8 years. We are going to
focus on simple ways to build our top
and bottom lines. We are growing our
commercial business, improving the
sales productivity of our inventory
and sales floor while taking out costs
and work that the customer is not
interested in.
6
03 04 05
$3,494
$3,770
$4,265
Sales
(in millions)
03 04 05
$1.39
$1.66
$2.13
Comparable Income from Continuing
Operations per Diluted Share
03 04 05
$1,379
$1,453
$1,555
Average Sales per Store
(in thousands)
0706
$4,844
$4,617
07
$1,527
06
$1,551
07
$2.28
06
$2.16
03 04 05
2,539
2,652
2,872
Number of Stores
07
3,261
06
3,082