Advance Auto Parts 2007 Annual Report Download - page 64
Download and view the complete annual report
Please find page 64 of the 2007 Advance Auto Parts annual report below. You can navigate through the pages in the report by either clicking on the pages listed below, or by using the keyword search tool below to find specific information within the annual report.-
 1
1 -
2
-
3
-
4
-
5
-
6
-
7
-
8
-
9
-
10
-
11
-
12
-
13
-
14
-
15
-
16
-
17
-
18
-
19
-
20
-
21
-
22
-
23
-
24
-
25
-
26
-
27
-
28
-
29
-
30
-
31
-
32
-
33
-
34
-
35
-
36
-
37
-
38
-
39
-
40
-
41
-
42
-
43
-
44
-
45
-
46
-
47
-
48
-
49
-
50
-
51
-
52
-
53
-
 54
54 -
 55
55 -
 56
56 -
 57
57 -
 58
58 -
 59
59 -
 60
60 -
 61
61 -
 62
62 -
 63
63 -
 64
64 -
 65
65 -
 66
66 -
 67
67 -
 68
68 -
 69
69 -
 70
70 -
 71
71 -
 72
72 -
 73
73 -
 74
74 -
75
-
76
-
77
-
78
-
79
-
80
-
81
-
82
-
83
-
84
-
85
-
86
-
87
-
88
-
89
-
90
-
91
-
92
-
93
-
94
-
95
-
96
-
97
-
98
-
99
-
100
-
101
-
102
-
103
-
104
-
105
-
106
-
107
-
108
-
109
 |
 |

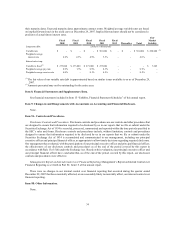
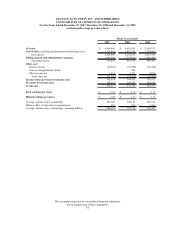
ADVANCE AUTO PARTS, INC. AND SUBSIDIARIES
CONSOLIDATED STATEMENTS OF OPERATIONS
For the Years Ended December 29, 2007, December 30, 2006 and December 31, 2005
(in thousands, except per share data)
2007 2006 2005
Net sales 4,844,404$ 4,616,503$ 4,264,971$
Cost of sales, including purchasing and warehousing costs 2,523,435 2,415,339 2,250,493
Gross profit 2,320,969 2,201,164 2,014,478
1,904,540 1,797,814 1,605,986
Operating income 416,429 403,350 408,492
Other, net:
Interest expense (34,809) (35,992) (32,384)
Gain on extinguishment of debt - 986 -
Other income, net 1,014 1,571 2,815
Total other, net (33,795) (33,435) (29,569)
Income before
p
rovision for income taxes 382,634 369,915 378,923
Provision for income taxes 144,317 138,597 144,198
Net income 238,317 231,318 234,725
Basic earnings per share 2.30$ 2.18$ 2.17$
Diluted earnings per share 2.28$ 2.16$ 2.13$
Average common shares outstanding 103,826 106,129 108,318
Dilutive effect of share-based compensation 828 995 1,669
Average common shares outstanding - assuming dilution 104,654 107,124 109,987
Fiscal Years Ended
Selling, general and administrative expenses
The accompanying notes to consolidated financial statements
are an integral part of these statements.
F-5