Advance Auto Parts 2007 Annual Report Download - page 52
Download and view the complete annual report
Please find page 52 of the 2007 Advance Auto Parts annual report below. You can navigate through the pages in the report by either clicking on the pages listed below, or by using the keyword search tool below to find specific information within the annual report.-
 1
1 -
2
-
3
-
4
-
5
-
6
-
7
-
8
-
9
-
10
-
11
-
12
-
13
-
14
-
15
-
16
-
17
-
18
-
19
-
20
-
21
-
22
-
23
-
24
-
25
-
26
-
27
-
28
-
29
-
30
-
31
-
32
-
33
-
34
-
35
-
36
-
37
-
38
-
39
-
40
-
41
-
 42
42 -
 43
43 -
 44
44 -
 45
45 -
 46
46 -
 47
47 -
 48
48 -
 49
49 -
 50
50 -
 51
51 -
 52
52 -
 53
53 -
 54
54 -
 55
55 -
 56
56 -
 57
57 -
 58
58 -
 59
59 -
 60
60 -
 61
61 -
 62
62 -
63
-
64
-
65
-
66
-
67
-
68
-
69
-
70
-
71
-
72
-
73
-
74
-
75
-
76
-
77
-
78
-
79
-
80
-
81
-
82
-
83
-
84
-
85
-
86
-
87
-
88
-
89
-
90
-
91
-
92
-
93
-
94
-
95
-
96
-
97
-
98
-
99
-
100
-
101
-
102
-
103
-
104
-
105
-
106
-
107
-
108
-
109
 |
 |
x$15.2 million increase in earnings exclusive of $18.7 million of incremental, non-cash, share-based
compensation expense compared to the same period in fiscal 2005;
x$19.5 million increase in depreciation and amortization;
x$24.1 million decrease in cash inflows primarily related to the sale of our private label credit card portfolio
in fiscal 2005;
x$24.9 million reduction in cash outflows, net of accounts payable, as a result of reducing inventory growth
rates in line with our current sales trend;
x$33.4 million increase in cash flows from other assets related to the timing of payments for normal
operating expenses, primarily our monthly rent;
x$17.5 million decrease in cash inflows relating to the timing of accrued operating expenses; and
x$30.3 million decrease in cash flows from tax benefits related to exercise of stock options.
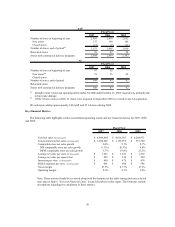
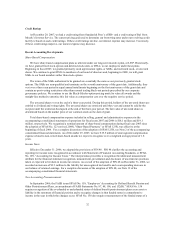
Investing Activities
For fiscal 2007, net cash used in investing activities decreased by $56.5 million to $202.1 million. Significant
components of this decrease consisted of:
xa decrease in capital expenditures of $48.0 million resulting primarily from less spending on capital assets
in our store locations, the impact of the reduced scope in remodels and fewer relocations as compared to
2006; and
xthe absence of a $12.5 million business acquisition payment made in fiscal 2006.
For fiscal 2006, net cash used in investing activities decreased by $44.2 million to $258.6 million. Significant
components of this decrease consisted of:
x$111.8 million related to acquisitions in fiscal 2005, of which $12.5 million was paid in fiscal 2006;
xan increase in capital expenditures of $42.4 million used primarily to accelerate our square footage growth
through adding new stores (including ownership of selected new stores) and remodeling existing stores.
Financing Activities
For fiscal 2007, net cash used in financing activities increased by $100.3 million to $204.9 million.
Cash flows from financing activities increased as result of:
xan $11.8 million cash inflow resulting from the timing of bank overdrafts;
x$17.8 million increase in financed vendor accounts payable, which reflected the growth in our vendor
financing program;
xan increase of $25.3 million from the issuance of common stock, resulting from an increase in the exercise
of stock options mainly associated with the departure of our former CEO and another executive officer
during 2007; and
xa $6.6 million cash inflow from additional tax benefits realized from the increased level of stock options
exercised.
Cash flows from financing activities decreased as result of:
xa reduction of $14.3 million in net borrowings primarily under our credit facilities;
x$6.0 million of additional cash dividends paid due primarily to the timing in payments; and
xan additional $145.4 million of common stock repurchased under our stock repurchase program.
For fiscal 2006, net cash used in financing activities increased by $70.3 million to $104.6 million. Significant
components of this increase consisted of:
x$46.0 million cash outflow resulting from the timing of bank overdrafts;
29