Advance Auto Parts 2007 Annual Report Download - page 9
Download and view the complete annual report
Please find page 9 of the 2007 Advance Auto Parts annual report below. You can navigate through the pages in the report by either clicking on the pages listed below, or by using the keyword search tool below to find specific information within the annual report.-
 1
1 -
 2
2 -
 3
3 -
 4
4 -
 5
5 -
 6
6 -
 7
7 -
 8
8 -
 9
9 -
 10
10 -
 11
11 -
 12
12 -
 13
13 -
 14
14 -
 15
15 -
 16
16 -
 17
17 -
 18
18 -
 19
19 -
 20
20 -
21
-
22
-
23
-
24
-
25
-
26
-
27
-
28
-
29
-
30
-
31
-
32
-
33
-
34
-
35
-
36
-
37
-
38
-
39
-
40
-
41
-
42
-
43
-
44
-
45
-
46
-
47
-
48
-
49
-
50
-
51
-
52
-
53
-
54
-
55
-
56
-
57
-
58
-
59
-
60
-
61
-
62
-
63
-
64
-
65
-
66
-
67
-
68
-
69
-
70
-
71
-
72
-
73
-
74
-
75
-
76
-
77
-
78
-
79
-
80
-
81
-
82
-
83
-
84
-
85
-
86
-
87
-
88
-
89
-
90
-
91
-
92
-
93
-
94
-
95
-
96
-
97
-
98
-
99
-
100
-
101
-
102
-
103
-
104
-
105
-
106
-
107
-
108
-
109
 |
 |

F
ISCAL
Y
EAR(1)
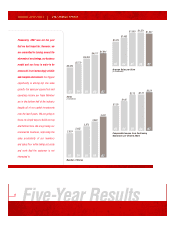
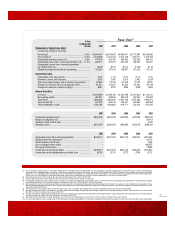
2007 2006 2005 2004 2003
Comparable income from continuing operations ...............................
$238,317 $231,318
$234,725 $188,027 $155,091
Add back items from footnote (4) .....................................................
--
- - (1,207)
Interest expense in 53rd week ...........................................................
--
- - (368)
Loss on extinguishment of debt ........................................................
--
- - (46,887)
Tax impact of above items ..................................................................
--
- - 18,658
Income from continuing operations ..................................................
$238,317 $231,318
$234,725 $188,027 $125,287
Income from continuing operations per diluted share .....................
$2.28 $2.16
$2.13 $1.66 $1.12
2007 2006 2005 2004 2003
Comparable operating income............................................................
$416,429 $403,350
$408,492 $328,758 $289,441
Merger and integration (10) ...............................................................
--
- - (10,417)
Operations effect on 53rd week..........................................................
--
- - 9,210
Operating income................................................................................
$416,429 $403,350
$408,492 $328,758 $288,234
5-Year
Compounded
Growth 2007 2006 2005 2004 2003
Statement of Operations Data:
(in thousands, except per share data)
Net sales(2)
..........................................................................
9.0% $4,844,404 $4,616,503 $4,264,971 $3,770,297 $3,430,680
Gross profit (3)
.................................................................
10.2% 2,320,969 2,201,164 2,014,478 1,753,371 1,575,756
Comparable operating income (4)
....................................
9.5% 416,429 403,350 408,492 328,758 289,441
Comparable income from continuing operations (5)
....
11.3% 238,317 231,318 234,725 188,027 155,091
Comparable income from continuing operations
per diluted share (5)
.....................................................................
$2.28 $2.16 $2.13 $1.66 $1.39
Weighted average diluted shares outstanding
..........................
104,654 107,124 109,987 113,222 112,115
Selected Store Data:
Comparable store sales growth
..................................................
0.8% 2.1% 8.7% 6.1% 3.1%
Number of stores, end of period
................................................
3,261 3,082 2,872 2,652 2,539
Total store square footage, end of period (in thousands)
.........
23,982 22,753 21,246 19,734 18,875
Average net sales per store (in thousands) (6)(7)
....................
$1,527 $1,551 $1,555 $1,453 $1,379
Average net sales per square foot (6)(8)
...................................
$207 $210 $209 $195 $186
Balance Sheet Data:
Inventory
.......................................................................................
$1,529,469 $1,463,340 $1,367,099 $1,201,450 $1,113,781
Net working capital
.......................................................................
456,897 498,553 406,476 416,302 372,509
Total assets
....................................................................................
2,805,566 2,682,681 2,542,149 2,201,962 1,983,071
Total net debt (9)
..........................................................................
521,018 500,318 448,187 433,863 464,598
Total stockholders' equity
............................................................
1,023,795 1,030,854 919,771 722,315 631,244
7
(1)
Our fiscal year consists of 52 or 53 weeks ending on the Saturday nearest to December 31. The Company excluded the operating results of the 53rd week in fiscal 2003 as
reconciled in the footnotes below; therefore, all fiscal years presented consist of 52 weeks. Fiscal year 2003 includes non-GAAP measures. The Company used these non-GAAP
measures as an indication of its earnings from its core operations and believes it is important to our stockholders due to the nature and significance of the excluded expenses.
Please see our reconciliation of comparable operating income and comparable income from continuing operations included in the table above.
(2)
Net sales for fiscal year 2003 exclude the effect of the 53rd week in the amount of $63,016.
(3)
Gross profit for fiscal year 2003 excludes the effect of the 53rd week in the amount of $28,762.
(4)
Comparable operating income excludes certain charges as included in the following reconciliation of this measurement to our operating income presented under generally accepted
accounting principles in our financial statements contained in the Form 10-K included in this annual report.
(5)
Comparable income from continuing operations excludes the items in footnote (4) above and the early extinguishment of debt. The above is a reconciliation of comparable income
from continuing operations to income from continuing operations presented under generally accepted accounting principles in our financial statements contained in the Form 10-K
included in this annual report.
(6)
The ending store count and/or store square footage used in the calculation of the 2005 ratios has been weighted for the period of the AI acquisition.
(7)
Average net sales per store is calculated as net sales divided by the average of beginning and ending number of stores for the respective period. The fiscal 2003 net sales exclude
the effect of the 53rd week in the amount of $63,016.
(8)
Average net sales per square foot is calculated as net sales divided by the average of the beginning and ending total store square footage for the respective period. The fiscal 2003
net sales exclude the effect of the 53rd week in the amount of $63,016.
(9)
Net debt includes total debt and bank overdrafts, less cash and cash equivalents as presented in the Form 10-K included in this annual report.
(10)
For more information on these charges refer to the footnotes to the table setting forth our "Selected Consolidated Financial Data" on page 17 in the Form 10-K included in this annual report.