Advance Auto Parts 2007 Annual Report Download - page 90
Download and view the complete annual report
Please find page 90 of the 2007 Advance Auto Parts annual report below. You can navigate through the pages in the report by either clicking on the pages listed below, or by using the keyword search tool below to find specific information within the annual report.-
 1
1 -
2
-
3
-
4
-
5
-
6
-
7
-
8
-
9
-
10
-
11
-
12
-
13
-
14
-
15
-
16
-
17
-
18
-
19
-
20
-
21
-
22
-
23
-
24
-
25
-
26
-
27
-
28
-
29
-
30
-
31
-
32
-
33
-
34
-
35
-
36
-
37
-
38
-
39
-
40
-
41
-
42
-
43
-
44
-
45
-
46
-
47
-
48
-
49
-
50
-
51
-
52
-
53
-
54
-
55
-
56
-
57
-
58
-
59
-
60
-
61
-
62
-
63
-
64
-
65
-
66
-
67
-
68
-
69
-
70
-
71
-
72
-
73
-
74
-
75
-
76
-
77
-
78
-
79
-
 80
80 -
 81
81 -
 82
82 -
 83
83 -
 84
84 -
 85
85 -
 86
86 -
 87
87 -
 88
88 -
 89
89 -
 90
90 -
 91
91 -
 92
92 -
 93
93 -
 94
94 -
 95
95 -
 96
96 -
 97
97 -
 98
98 -
 99
99 -
 100
100 -
101
-
102
-
103
-
104
-
105
-
106
-
107
-
108
-
109
 |
 |

ADVANCE AUTO PARTS, INC. AND SUBSIDIARIES
NOTES TO THE CONSOLIDATED FINANCIAL STATEMENTS – (Continued)
December 29, 2007, December 30, 2006 and December 31, 2005
(in thousands, except per share data)
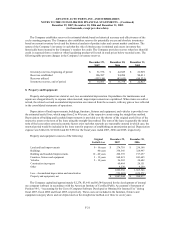
deferral of compensation as earned in the form of an annual retainer for directors and wages for certain highly
compensated employees of the Company. These deferred stock units are settled in common stock with the
participants at a future date or over a specified time period as elected by the participants in accordance with the DSU
Plan.
Stock Options and SARs
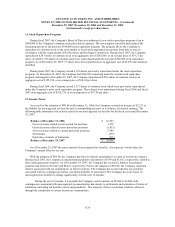
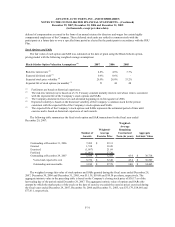
The fair value of each option and SAR was estimated on the date of grant using the Black-Scholes option-
pricing model with the following weighted average assumptions:
Black-Scholes Option Valuation Assumptions
(1)
2007 2006 2005
Risk-free interest rate
(2)
4.8% 4.6% 3.7%
Expected dividend yield
(3)
0.6% 0.6% -
Expected stock price volatility
(4)
29.0% 28.0% 33.2%
Expected life of stock options (in months)
(5)
51 44 48
(1) Forfeitures are based on historical experience.
(2) The risk-free interest rate is based on a U.S. Treasury constant maturity interest rate whose term is consistent
with the expected life of the Company’s stock options and SARs.
(3) The Company declared its first ever cash dividend beginning in its first quarter of 2006.
(4) Expected volatility is based on the historical volatility of the Company’s common stock for the period
consistent with the expected life of the Company’s stock options and SARs.
(5) The expected life of the Company’s stock options and SARs represents the estimated period of time until
exercise and is based on historical experience of such awards.
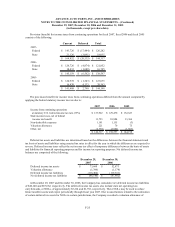
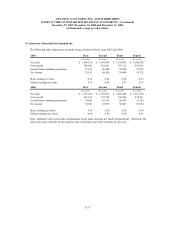
The following table summarizes the fixed stock option and SAR transactions for the fiscal year ended
December 29, 2007:
Number of
Awards
Weighted-
Average
Exercise Price
Weighted-
Average
Remaining
Contractual
Term (in years)
Aggregate
Intrinsic Value
Outstanding at December 31, 2006 7,269 29.31$
Granted 1,538 38.20
Exercised (1,867) 21.69
Forfeited (1,001) 37.20
Outstanding at December 29, 2007 5,939 32.68$ 4.34 36,718$
Vested and expected to vest 5,732 32.48$ 4.34 36,509$
Outstanding and exercisable 3,182 27.78$ 3.40 34,465$
The weighted average fair value of stock options and SARs granted during the fiscal years ended December 29,
2007, December 30, 2006 and December 31, 2005, was $11.39, $10.68 and $10.54 per share, respectively. The
aggregate intrinsic value in the preceding table is based on the Company’s closing stock price of $38.17 as of the
last trading day of the period ended December 29, 2007. The aggregate intrinsic value of options and SARs (the
amount by which the market price of the stock on the date of exercise exceeded the exercise price) exercised during
the fiscal years ended December 29, 2007, December 30, 2006 and December 31, 2005, was $33,179, $14,001 and
$77,611, respectively.
F-31