Advance Auto Parts 2007 Annual Report Download - page 49
Download and view the complete annual report
Please find page 49 of the 2007 Advance Auto Parts annual report below. You can navigate through the pages in the report by either clicking on the pages listed below, or by using the keyword search tool below to find specific information within the annual report.-
 1
1 -
2
-
3
-
4
-
5
-
6
-
7
-
8
-
9
-
10
-
11
-
12
-
13
-
14
-
15
-
16
-
17
-
18
-
19
-
20
-
21
-
22
-
23
-
24
-
25
-
26
-
27
-
28
-
29
-
30
-
31
-
32
-
33
-
34
-
35
-
36
-
37
-
38
-
 39
39 -
 40
40 -
 41
41 -
 42
42 -
 43
43 -
 44
44 -
 45
45 -
 46
46 -
 47
47 -
 48
48 -
 49
49 -
 50
50 -
 51
51 -
 52
52 -
 53
53 -
 54
54 -
 55
55 -
 56
56 -
 57
57 -
 58
58 -
 59
59 -
60
-
61
-
62
-
63
-
64
-
65
-
66
-
67
-
68
-
69
-
70
-
71
-
72
-
73
-
74
-
75
-
76
-
77
-
78
-
79
-
80
-
81
-
82
-
83
-
84
-
85
-
86
-
87
-
88
-
89
-
90
-
91
-
92
-
93
-
94
-
95
-
96
-
97
-
98
-
99
-
100
-
101
-
102
-
103
-
104
-
105
-
106
-
107
-
108
-
109
 |
 |
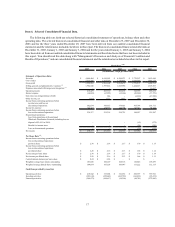
Income tax expense for 2007 was $144.3 million, as compared to $138.6 million for 2006. Our effective income
tax rate was 37.7% and 37.5% for 2007 and 2006, respectively.
We generated net income of $238.3 million, or $2.28 per diluted share, for 2007, as compared to $231.3
million, or $2.16 per diluted share, for 2006. As a percentage of sales, net income for 2007 was 4.9%, as compared
to 5.0% for 2006.
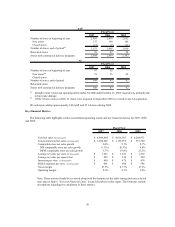
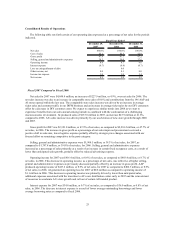
Fiscal 2006 Compared to Fiscal 2005
Net sales for 2006 were $4,616.5 million, an increase of $351.5 million, or 8.2%, over net sales for 2005. The
net sales increase was due to an increase in comparable store sales of 2.1%, contributions from the 190 AAP stores
opened within the last year and sales from AI. AI, which was acquired in September 2005, produced sales of $111.1
million in 2006 compared to $30.3 million for the partial period in 2005. The comparable store sales increase was
driven by an increase in average ticket sales and customer traffic in our DIFM business and an increase in average
ticket sales by our DIY customers offset by a decrease in DIY customer count.
Gross profit for 2006 was $2,201.2 million, or 47.7% of net sales, as compared to $2,014.5 million, or 47.2% of
net sales, in 2005. The increase in gross profit as a percentage of sales reflects the positive impact of our ongoing
category management initiatives, including improved procurement costs and a positive shift in sales mix, and
logistics efficiencies.
Selling, general and administrative expenses were $1,797.8 million, or 39.0% of net sales, for 2006, as
compared to $1,606.0 million, or 37.6% of net sales, for 2005. Selling, general and administrative expenses
increased as a percentage of sales as a result of:
xrecording share-based compensation expense of approximately 0.4% of net sales upon the implementation of
SFAS 123R on January 1, 2006;
xa 0.5% increase in certain fixed costs as a percentage of sales during the year, including rent and
depreciation, as a result of low comparable sales growth; and
xa 0.3% increase in expenses associated with higher costs for insurance programs, including workers’
compensation, auto liability and general liability.
Additionally, AI contributed approximately 0.2% of selling, general and administrative expenses as a result of
the reinvestment of working capital to accelerate their new store growth.
Interest expense for 2006 was $36.0 million, or 0.8% of net sales, as compared to $32.4 million, or 0.7% of net
sales, in 2005. The increase in interest expense is a result of both higher average outstanding debt levels and
borrowing rates as compared to fiscal 2005. In addition, other income for fiscal 2006 decreased as a result of less
interest income associated with lower cash balances throughout the year.
Income tax expense for 2006 was $138.6 million, as compared to $144.2 million for 2005. Our effective
income tax rate was 37.5% and 38.1% for 2006 and 2005, respectively.
We generated net income of $231.3 million, or $2.16 per diluted share, for 2006, as compared to $234.7
million, or $2.13 per diluted share, for 2005. As a percentage of sales, net income for 2006 was 5.0%, as compared
to 5.5% for 2005. Our earnings per diluted share results reflect the impact on both earnings and the diluted share
count of implementing FAS 123R as further explained in this management’s discussion and analysis and in the notes
to our financial statements contained elsewhere in this Form 10-K.
26