Advance Auto Parts 2007 Annual Report Download - page 40
Download and view the complete annual report
Please find page 40 of the 2007 Advance Auto Parts annual report below. You can navigate through the pages in the report by either clicking on the pages listed below, or by using the keyword search tool below to find specific information within the annual report.-
 1
1 -
2
-
3
-
4
-
5
-
6
-
7
-
8
-
9
-
10
-
11
-
12
-
13
-
14
-
15
-
16
-
17
-
18
-
19
-
20
-
21
-
22
-
23
-
24
-
25
-
26
-
27
-
28
-
29
-
 30
30 -
 31
31 -
 32
32 -
 33
33 -
 34
34 -
 35
35 -
 36
36 -
 37
37 -
 38
38 -
 39
39 -
 40
40 -
 41
41 -
 42
42 -
 43
43 -
 44
44 -
 45
45 -
 46
46 -
 47
47 -
 48
48 -
 49
49 -
 50
50 -
51
-
52
-
53
-
54
-
55
-
56
-
57
-
58
-
59
-
60
-
61
-
62
-
63
-
64
-
65
-
66
-
67
-
68
-
69
-
70
-
71
-
72
-
73
-
74
-
75
-
76
-
77
-
78
-
79
-
80
-
81
-
82
-
83
-
84
-
85
-
86
-
87
-
88
-
89
-
90
-
91
-
92
-
93
-
94
-
95
-
96
-
97
-
98
-
99
-
100
-
101
-
102
-
103
-
104
-
105
-
106
-
107
-
108
-
109
 |
 |

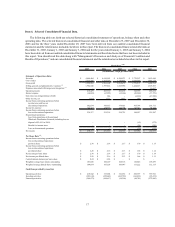
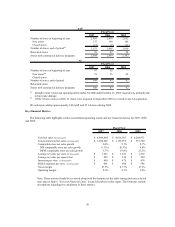
Item 6. Selected Consolidated Financial Data.
The following table sets forth our selected historical consolidated statement of operations, balance sheet and other
operating data. The selected historical consolidated financial and other data at December 29, 2007 and December 30,
2006 and for the three years ended December 29, 2007 have been derived from our audited consolidated financial
statements and the related notes included elsewhere in this report. The historical consolidated financial and other data at
December 31, 2005, January 1, 2005 and January 3, 2004 and for the years ended January 1, 2005 and January 3, 2004
have been derived from our audited consolidated financial statements and the related notes that have not been included in
this report. You should read this data along with "Management's Discussion and Analysis of Financial Condition and
Results of Operations," and our consolidated financial statements and the related notes included elsewhere in this report.
2007 2006 2005 2004 2003
Statement of Operations Data:
Net sales 4,844,404$ 4,616,503$ 4,264,971$ 3,770,297$ 3,493,696$
Cost of sales 2,523,435 2,415,339 2,250,493 2,016,926 1,889,178
Gross profit 2,320,969 2,201,164 2,014,478 1,753,371 1,604,518
Selling, general and administrative expenses
(3)
1,904,540 1,797,814 1,605,986 1,424,613 1,305,867
Expenses associated with merger and integration
(4)
- - - -
10,417
Operating income 416,429 403,350 408,492 328,758 288,234
Interest expense (34,809) (35,992) (32,384) (20,069) (37,576)
Gain (loss) on extinguishment of debt
-
986
-
(3,230) (47,288)
Other income, net 1,014 1,571 2,815 289 341
Income from continuing operations before
income taxes and loss on
discontinued operations 382,634 369,915 378,923 305,748 203,711
Income tax expense 144,317 138,597 144,198 117,721 78,424
Income from continuing operations before
loss on discontinued operations 238,317 231,318 234,725 188,027 125,287
Discontinued operations:
Loss from operations of discontinued
Wholesale Distribution Network (including loss on
disposal of $2,693 in 2003)
- - -
(63) (572)
Benefit for income taxes
- - -
(24) (220)
Loss on discontinued operations
- - -
(39) (352)
Net income 238,317$ 231,318$ 234,725$ 187,988$ 124,935$
Per Share Data
(5)
:
Income from continuing operations before
loss on discontinued operations
per basic share 2.30$ 2.18$ 2.17$ 1.70$ 1.15$
Income from continuing operations before
loss on discontinued operations
per diluted share 2.28$ 2.16$ 2.13$ 1.66$ 1.12$
Net income per basic share 2.30$ 2.18$ 2.17$ 1.70$ 1.14$
Net income per diluted share 2.28$ 2.16$ 2.13$ 1.66$ 1.11$
Cash dividends declared per basic share 0.24$ 0.24$ -$ -$ -$
Weighted average basic shares outstanding 103,826 106,129 108,318 110,846 109,499
Weighted average diluted shares outstanding 104,654 107,124 109,987 113,222 112,115
Cash flows provided by (used in):
Operating activities 410,542$ 333,604$ 321,632$ 260,397$ 355,921$
Investing activities (202,143) (258,642) (302,780) (166,822) (85,474)
Financing activities (204,873) (104,617) (34,390) (48,741) (272,845)
Fiscal Year
(1)(2)
(in thousands, except per share data)
17