Advance Auto Parts 2007 Annual Report Download - page 48
Download and view the complete annual report
Please find page 48 of the 2007 Advance Auto Parts annual report below. You can navigate through the pages in the report by either clicking on the pages listed below, or by using the keyword search tool below to find specific information within the annual report.-
 1
1 -
2
-
3
-
4
-
5
-
6
-
7
-
8
-
9
-
10
-
11
-
12
-
13
-
14
-
15
-
16
-
17
-
18
-
19
-
20
-
21
-
22
-
23
-
24
-
25
-
26
-
27
-
28
-
29
-
30
-
31
-
32
-
33
-
34
-
35
-
36
-
37
-
 38
38 -
 39
39 -
 40
40 -
 41
41 -
 42
42 -
 43
43 -
 44
44 -
 45
45 -
 46
46 -
 47
47 -
 48
48 -
 49
49 -
 50
50 -
 51
51 -
 52
52 -
 53
53 -
 54
54 -
 55
55 -
 56
56 -
 57
57 -
 58
58 -
59
-
60
-
61
-
62
-
63
-
64
-
65
-
66
-
67
-
68
-
69
-
70
-
71
-
72
-
73
-
74
-
75
-
76
-
77
-
78
-
79
-
80
-
81
-
82
-
83
-
84
-
85
-
86
-
87
-
88
-
89
-
90
-
91
-
92
-
93
-
94
-
95
-
96
-
97
-
98
-
99
-
100
-
101
-
102
-
103
-
104
-
105
-
106
-
107
-
108
-
109
 |
 |

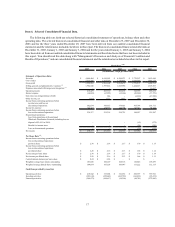
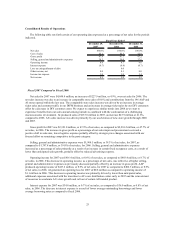
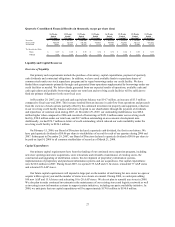
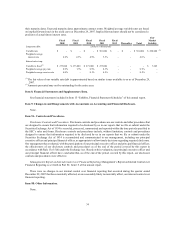
Consolidated Results of Operations
The following table sets forth certain of our operating data expressed as a percentage of net sales for the periods
indicated.
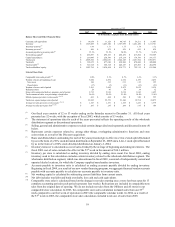
December 29, December 30, December 31,
2007 2006 2005
Net sales 100.0% 100.0% 100.0%
Cost of sales 52.1 52.3 52.8
Gross profit 47.9 47.7 47.2
Selling, general and administrative expenses 39.3 39.0 37.6
Operating income 8.6 8.7 9.6
Interest expense (0.7) (0.8) (0.7)
Loss on extinguishment of debt - 0.0 -
Other income, net 0.0 0.1 0.0
Income tax expense 3.0 3.0 3.4
Net income 4.9 5.0 5.5
Fiscal Year Ended
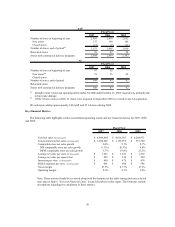
Fiscal 2007 Compared to Fiscal 2006
Net sales for 2007 were $4,844.4 million, an increase of $227.9 million, or 4.9%, over net sales for 2006. The
net sales increase was due to an increase in comparable store sales of 0.8% and contributions from the 196 AAP and
AI stores opened within the last year. The comparable store sales increase was driven by an increase in average
ticket sales and customer traffic in our DIFM business and an increase in average ticket sales by our DIY customers
offset by a decrease in DIY customer count. We expect to experience similar trends into 2008 as we start to
experience benefits from our sales and advertising initiatives combined with the continuation of a challenging
macroeconomic environment. AI produced sales of $135.0 million in 2007, an increase $23.9 million or 21.6%,
compared to 2006. AI’s sales increase was driven primarily by our acceleration of new-store growth through 2006
and 2007.
Gross profit for 2007 was $2,321.0 million, or 47.9% of net sales, as compared to $2,201.2 million, or 47.7% of
net sales, in 2006. The increase in gross profit as a percentage of net sales improved procurement costs and a
positive shift in sales mix, lower logistics expense partially offset by strategic price changes associated with our
focused effort on remaining competitive in the parts category.
Selling, general and administrative expenses were $1,904.5 million, or 39.3% of net sales, for 2007, as
compared to $1,797.8 million, or 39.0% of net sales, for 2006. Selling, general and administrative expenses
increased as a percentage of sales primarily as a result of an increase in certain fixed occupancy costs, as a result of
lower than anticipated sales growth, partially offset by reduced advertising expense.
Operating income for 2007 was $416.4 million, or 8.6% of net sales, as compared to $403.4 million, or 8.7% of
net sales, in 2006. This decrease in operating income, as a percentage of net sales, was reflective of higher selling,
general and administrative expenses as previously discussed partially offset by an increase in gross profit. AAP
produced operating income of $417.2 million, or 8.9% of net sales, for 2007 as compared to $402.3 million, or 8.9%
of net sales, in 2006. AI generated an operating loss for 2007 of $0.8 million as compared to operating income of
$1.1 million in 2006. This decrease in operating income was primarily driven by lower than anticipated sales,
additional expenses associated with the transition to AI’s new distribution center early in 2007 and the reinvestment
of resources to accelerate AI’s store growth and roll out of certain AI branded product.
Interest expense for 2007 was $34.8 million, or 0.7% of net sales, as compared to $36.0 million, or 0.8% of net
sales, in 2006. The decrease in interest expense is a result of lower average outstanding borrowings and lower
average borrowing rates as compared to fiscal 2006.
25