Advance Auto Parts 2007 Annual Report Download - page 66
Download and view the complete annual report
Please find page 66 of the 2007 Advance Auto Parts annual report below. You can navigate through the pages in the report by either clicking on the pages listed below, or by using the keyword search tool below to find specific information within the annual report.-
 1
1 -
2
-
3
-
4
-
5
-
6
-
7
-
8
-
9
-
10
-
11
-
12
-
13
-
14
-
15
-
16
-
17
-
18
-
19
-
20
-
21
-
22
-
23
-
24
-
25
-
26
-
27
-
28
-
29
-
30
-
31
-
32
-
33
-
34
-
35
-
36
-
37
-
38
-
39
-
40
-
41
-
42
-
43
-
44
-
45
-
46
-
47
-
48
-
49
-
50
-
51
-
52
-
53
-
54
-
55
-
 56
56 -
 57
57 -
 58
58 -
 59
59 -
 60
60 -
 61
61 -
 62
62 -
 63
63 -
 64
64 -
 65
65 -
 66
66 -
 67
67 -
 68
68 -
 69
69 -
 70
70 -
 71
71 -
 72
72 -
 73
73 -
 74
74 -
 75
75 -
 76
76 -
77
-
78
-
79
-
80
-
81
-
82
-
83
-
84
-
85
-
86
-
87
-
88
-
89
-
90
-
91
-
92
-
93
-
94
-
95
-
96
-
97
-
98
-
99
-
100
-
101
-
102
-
103
-
104
-
105
-
106
-
107
-
108
-
109
 |
 |

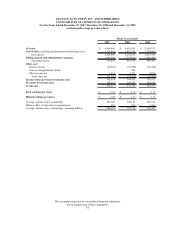
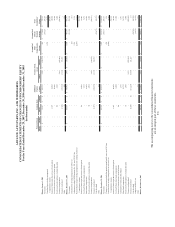
ADVANCE AUTO PARTS, INC. AND SUBSIDIARIES
CONSOLIDATED STATEMENTS OF CASH FLOWS
For the Years Ended December 29, 2007, December 30, 2006 and December 31, 2005
(in thousands)
2007 2006 2005
Cash flows from operating activities:
Net income 238,317$ 231,318$ 234,725$
Adjustments to reconcile net income to net cash provided by
operating activities:
Depreciation and amortization 147,264 139,423 119,938
Amortization of deferred debt issuance costs 236 534 620
Share-based compensation 18,096 19,052 363
Loss on disposal of property and equipment, net 11,066 2,103 503
(Benefit) provision for deferred income taxes (20,535) (6,562) 2,790
Excess tax benefit from share-based compensation (11,841) (5,272) -
Tax benefit related to exercise of stock options - - 30,300
Loss on extinguishment of debt - 1,887 -
Net decrease (increase) in:
Receivables, net 5,951 (2,318) 21,819
Inventories, net (66,129) (92,239) (130,426)
Other assets (10,709) 9,412 (23,963)
Net increase (decrease) in:
Accounts payable 37,383 22,339 35,610
Accrued expenses 55,256 15,264 32,805
Other liabilities 6,187 (1,337) (3,452)
Net cash provided by operating activities 410,542 333,604 321,632
Cash flows from investing activities:
Purchases of property and equipment (210,600) (258,586) (216,214)
Insurance proceeds related to damaged property 6,636 - -
Business acquisitions, net of cash acquired - (12,500) (99,300)
Proceeds from sales of property and equipment 1,821 12,444 12,734
Net cash used in investing activities (202,143) (258,642) (302,780)
Cash flows from financing activities:
(Decrease) increase in bank overdrafts (4,206) (15,964) 29,986
Increase in financed vendor accounts payable 26,006 8,192 62,455
Early extinguishment of debt -
(433,775) -
Dividends paid (25,152) (19,153) -
(Payments) borrowings on note payable 4,232 (60) 500
Borrowings under credit facilities 495,400 678,075 1,500
Payments on credit facilities (471,200) (205,800) (33,200)
Payment of debt related costs (821) (1,070) -
Proceeds from the issuance of common stock, primarily exercise
of stock options 42,547 17,203 32,275
Excess tax benefit from share-based compensation 11,841 5,272 -
Repurchase of common stock (282,910) (137,560) (101,594)
Borrowings secured by trade receivables (610) 23 (26,312)
Net cash used in financing activities (204,873) (104,617) (34,390)
Net increase (decrease) in cash and cash equivalents 3,526 (29,655) (15,538)
Cash and cash equivalents, beginning of period 11,128 40,783 56,321
Cash and cash equivalents, end of period 14,654$ 11,128$ 40,783$
Fiscal Years Ended
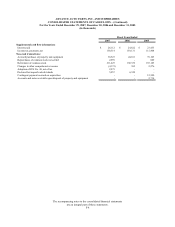
The accompanying notes to the consolidated financial statements
are an integral part of these statements.
F-7