Advance Auto Parts 2005 Annual Report Download - page 8
Download and view the complete annual report
Please find page 8 of the 2005 Advance Auto Parts annual report below. You can navigate through the pages in the report by either clicking on the pages listed below, or by using the keyword search tool below to find specific information within the annual report.-
 1
1 -
 2
2 -
 3
3 -
 4
4 -
 5
5 -
 6
6 -
 7
7 -
 8
8 -
 9
9 -
 10
10 -
 11
11 -
 12
12 -
 13
13 -
 14
14 -
 15
15 -
 16
16 -
 17
17 -
 18
18 -
 19
19 -
20
-
21
-
22
-
23
-
24
-
25
-
26
-
27
-
28
-
29
-
30
-
31
-
32
-
33
-
34
-
35
-
36
-
37
-
38
-
39
-
40
-
41
-
42
-
43
-
44
-
45
-
46
-
47
-
48
-
49
-
50
-
51
-
52
-
53
-
54
-
55
-
56
-
57
-
58
-
59
-
60
-
61
-
62
-
63
-
64
-
65
-
66
-
67
-
68
 |
 |

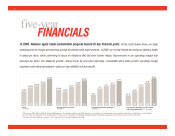
five-year
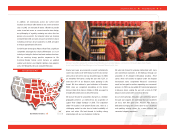
In 2005, Advance again made considerable progress toward its key financial goals. As the charts below show, our sales,
operating income margin and earnings growth all showed solid improvements. In 2005, we moved toward becoming an industry leader
in sales per store, while continuing to focus on initiatives that will drive further steady improvement in our operating margin and
earnings per share. Our balanced growth—being driven by new-store openings, comparable-store sales growth, operating margin
expansion and share repurchases—gives us clear visibility to future results.
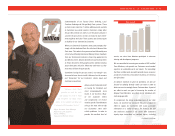
01 02 03 04 05
$2,420
$3,204 $3,494
$3,770
$4,265
Sales
(in millions)
01 02 03 04 05
4.9%
7.2%
8.4% 8.7%
9.6%
Comparable Operating Margin (1)
(in percent)
01 02 03 04 05
$0.41
$0.87
$1.39
$1.66
$2.13
Comparable Earnings per Share from
Continuing Operations (1)(2)
(in dollars)
01 02 03 04 05
$1,346 $1,303
$1,379
$1,453
$1,551
Average Sales per Store
(in millions)
(1) Fiscal years 2001, 2002 and 2003 include non-GAAP measures. The Company used these non-GAAP measures as an indication of its earnings from its core operations and believes it is important to our Stockholders
due to the nature and significance of the excluded expenses. Please see our reconciliation of comparable operating margin and comparable earnings per share included on page 7 of this annual report.
(2) Amounts referenced reflect the Company’s 3-for-2 stock split, which took effect September 26, 2005.
6
FINANCIALS