Advance Auto Parts 2005 Annual Report Download - page 30
Download and view the complete annual report
Please find page 30 of the 2005 Advance Auto Parts annual report below. You can navigate through the pages in the report by either clicking on the pages listed below, or by using the keyword search tool below to find specific information within the annual report.-
 1
1 -
2
-
3
-
4
-
5
-
6
-
7
-
8
-
9
-
10
-
11
-
12
-
13
-
14
-
15
-
16
-
17
-
18
-
19
-
 20
20 -
 21
21 -
 22
22 -
 23
23 -
 24
24 -
 25
25 -
 26
26 -
 27
27 -
 28
28 -
 29
29 -
 30
30 -
 31
31 -
 32
32 -
 33
33 -
 34
34 -
 35
35 -
 36
36 -
 37
37 -
 38
38 -
 39
39 -
 40
40 -
41
-
42
-
43
-
44
-
45
-
46
-
47
-
48
-
49
-
50
-
51
-
52
-
53
-
54
-
55
-
56
-
57
-
58
-
59
-
60
-
61
-
62
-
63
-
64
-
65
-
66
-
67
-
68
 |
 |
LIQUIDITY AND CAPITAL RESOURCES
Overview of Liquidity
Our primary cash requirements include the pur-
chase of inventory, capital expenditures and contrac-
tual obligations. In addition, we have used available
funds to repurchase shares under our stock repur-
chase program. We have funded these requirements
primarily through cash generated from operations
supplemented by borrowings under our senior credit
facility as needed.
At December 31, 2005, our cash balance was
$40.8 million, a decrease of $15.5 million compared
to fiscal year-end 2004. Our cash balance decreased
primarily due to cash invested in business acquisi-
tions during 2005, partially offset by cash generated
from our increased earnings during 2005 as com-
pared to 2004. At December 31, 2005, we had out-
standing indebtedness consisting primarily of
borrowings of $438.3 million under our senior credit
facility, a decrease of $31.2 million from 2004.
Additionally, we had $54.6 million in letters of credit
outstanding, which reduced our cash availability
under the revolving credit facility to $145.4 million.
Capital Expenditures
Our primary capital requirements have been the
funding of our continued store expansion program,
including new store openings and store acquisitions,
store relocations and remodels, inventory requirements,
the construction and upgrading of distribution centers,
the development and implementation of proprietary
information systems and our acquisitions.
Our capital expenditures were $216.2 million in
2005. These amounts included costs related to new
store openings, the upgrade of our information sys-
tems, remodels and relocations of existing stores,
including the completion of our physical conversion
of stores acquired in the Discount acquisition to our
Advance Auto Parts store format. In 2006 we antici-
pate that our capital expenditures will be approxi-
mately $260.0 million to $280.0 million.
Our new stores, if leased, require capital expendi-
tures of approximately $170,000 per store and an
inventory investment of approximately $170,000
per store, net of vendor payables. A portion of the
inventory investment is held at a distribution facility.
Pre-opening expenses, consisting primarily of store
set-up costs and training of new store Team Members,
average approximately $20,000 per store and are
expensed when incurred.
Our future capital requirements will depend in
large part on the number of and timing for new stores
we open or acquire within a given year and the number
of stores we relocate or remodel. During fiscal 2005,
we opened 231 stores, including 80 stores acquired
as part of the acquisitions of AI and Lappen Auto
Supply. We anticipate adding at least 170 to 180 new
stores during fiscal 2006, excluding any acquisitions.
Vendor Financing Program
Historically, we have negotiated extended payment
terms from suppliers that help finance inventory
growth, and we believe that we will be able to continue
financing much of our inventory growth through
such extended payment terms. In fiscal 2004, we
entered into a short-term financing program with a
bank for certain merchandise purchases. In sub-
stance, the program allows us to borrow money from
the bank to finance purchases from our vendors. This
MANAGEMENT’S DISCUSSION AND ANALYSIS OF FINANCIAL CONDITION AND RESULTS OF OPERATIONS
(continued)
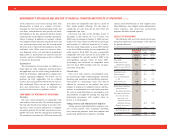
Income tax expense for 2004 was $117.7 million, as compared to $78.4 million for 2003. This increase in
income tax expense primarily reflected our higher earnings. Our effective income tax rate was 38.5% for both
2004 and 2003.
We recorded net income of $188.0 million, or $1.66 per diluted share for 2004, as compared to $124.9 million,
or $1.11 per diluted share for 2003. As a percentage of sales, net income for 2004 was 5.0%, as compared to
3.6% for 2003. Our net income for 2003 included the effect of expenses associated with merger and integration
and loss on extinguishment of debt of $35.5 million, or $0.31 per diluted share. These per share amounts reflect
the 3-for-2 stock split declared in 2005.
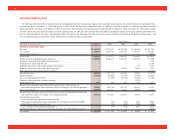
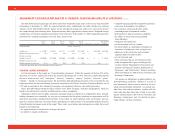
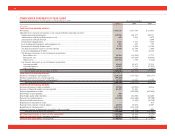
Quarterly Financial Results (in thousands, except per share data)
16-Weeks 12-Weeks 12-Weeks 12-Weeks 16-Weeks 12-Weeks 12-Weeks 12-Weeks
Ended Ended Ended Ended Ended Ended Ended Ended
4/23/05 7/16/05 10/8/05 12/31/05 4/24/04 7/17/04 10/9/04 1/1/05
Net sales....................... $1,258,364 $1,023,146 $1,019,736 $963,725 $1,122,918 $908,412 $890,161 $848,806
Gross profit .................. 600,931 482,050 481,415 450,082 520,898 422,302 416,515 393,656
Net income................... $ 68,647 $ 65,929 $ 60,793 $ 39,356 $ 51,291 $ 53,235 $ 51,393 $ 32,069
Net income per share:
Basic(1) .......................... $ 0.64 $ 0.61 $ 0.56 $ 0.36 $ 0.46 $ 0.47 $ 0.46 $ 0.29
Diluted(1) ....................... $ 0.63 $ 0.60 $ 0.55 $ 0.36 $ 0.45 $ 0.47 $ 0.45 $ 0.29
(1) Amounts reflect the effect of a 3-for-2 stock split of our common stock distributed on September 23, 2005.
28