Advance Auto Parts 2005 Annual Report Download - page 32
Download and view the complete annual report
Please find page 32 of the 2005 Advance Auto Parts annual report below. You can navigate through the pages in the report by either clicking on the pages listed below, or by using the keyword search tool below to find specific information within the annual report.-
 1
1 -
2
-
3
-
4
-
5
-
6
-
7
-
8
-
9
-
10
-
11
-
12
-
13
-
14
-
15
-
16
-
17
-
18
-
19
-
20
-
21
-
 22
22 -
 23
23 -
 24
24 -
 25
25 -
 26
26 -
 27
27 -
 28
28 -
 29
29 -
 30
30 -
 31
31 -
 32
32 -
 33
33 -
 34
34 -
 35
35 -
 36
36 -
 37
37 -
 38
38 -
 39
39 -
 40
40 -
 41
41 -
 42
42 -
43
-
44
-
45
-
46
-
47
-
48
-
49
-
50
-
51
-
52
-
53
-
54
-
55
-
56
-
57
-
58
-
59
-
60
-
61
-
62
-
63
-
64
-
65
-
66
-
67
-
68
 |
 |

• $20.2 million increase in accrued expenses related
to the timing of payments for normal operating
expenses.
For fiscal 2004, net cash provided by operating
activities decreased $92.2 million to $263.7 million.
Significant components of this decrease consisted of:
• $63.1 million increase in earnings from fiscal 2003;
• $47.2 million reduction in deferred income tax
provision, primarily reflective of (1) the reduction
in operating loss carryforwards from prior years
and (2) the impact of the loss on extinguishment
of debt from fiscal 2003;
• $22.8 million increase in inventory growth; and
• $77.9 million decrease in cash flow from accounts
payable, excluding the impact of our vendor
financing program which began in fiscal 2004.
Investing Activities
For fiscal 2005, net cash used in investing activities
increased by $136.0 million to $302.8 million.
Significant components of this increase consisted of:
• $99.3 million used to acquire AI and Lappen Auto
Supply, net of cash acquired; and
• capital expenditures of $36.4 million used prima-
rily to accelerate our square footage growth
through new stores (including ownership of select-
ed new stores), the acquisition of certain leased
stores and an increase in store relocations.
For fiscal 2004, net cash used in investing activi-
ties increased by $81.3 million to $166.8 million.
The primary increase in cash used in investing activ-
ities related to an increase in capital expenditures of
$50.0 million for the construction and preparation of
our Northeastern distribution center.
Financing Activities
For fiscal 2005, net cash used in financing activi-
ties decreased by $14.2 million to $37.9 million.
30
MANAGEMENT’S DISCUSSION AND ANALYSIS OF FINANCIAL CONDITION AND RESULTS OF OPERATIONS
(continued)
Significant components of this decrease consisted of:
• $40.9 million cash inflow resulting from the timing of bank overdrafts;
• $161.2 million cash outflow resulting from a reduction in net borrowings;
• $105.0 million used for early extinguishment of debt in fiscal 2004;
• $44.8 million decrease in cash used to repurchase shares of our common stock under our stock repurchase
program;
• $32.6 million decrease resulting from the repayment of secured borrowings in connection with the reduction
of trade receivables discussed above; and
• $13.8 million in cash from the increase in financed vendor accounts payable and proceeds from the exercise of
stock options.
For fiscal 2004, net cash used in financing activities decreased by $220.7 million to $52.1 million, primarily
due to a cash outflow of $406.4 million during fiscal 2003 for the early redemption of our senior discount
debentures and senior subordinated notes. Cash used for financing activities in fiscal 2004 consisted primarily of:
• $146.4 million used to repurchase shares of our common stock under our stock repurchase program;
• a $56.9 million cash inflow associated with inventory purchased under our vendor financing program;
• a $25.0 million increase in net borrowings as a result of $105.0 million in principal prepayments on our previ-
ous senior credit facility prior to scheduled maturity, offset by borrowings from our amended senior credit
facility; and
• $20.5 million in proceeds from exercises of stock options.
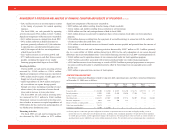
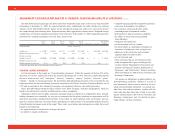
CONTRACTUAL OBLIGATIONS
Our future contractual obligations related to long-term debt, operating leases and other contractual obligations
at December 31, 2005 were as follows:
Fiscal Fiscal Fiscal Fiscal Fiscal
Contractual Obligations Total 2006 2007 2008 2009 2010 Thereafter
(in thousands)
Long-term debt ........................................... $ 438,800 $ 32,760 $ 32,093 $ 63,450 $ 52,771 $257,573 $ 153
Interest payments........................................ 81,001 11,808 23,460 20,606 17,306 7,818 3
Letters of credit .......................................... 54,579 54,579 — — — — —
Operating leases ......................................... 1,648,238 217,047 194,900 177,156 156,907 135,624 766,604
Purchase obligations(1)................................. 2,014 1,389 500 125 — — —
Financed vendor accounts payable ............. 119,351 — — — — — —
Other long-term liabilities(2) ........................ 74,874 — — — — — —
Contingent consideration(3) ......................... $ 12,500 $ 12,500 $ — $ — $ — $ — $ —
(1) For the purposes of this table, purchase obligations are defined as agreements that are enforceable and legally binding, a term of
greater than one year and that specify all significant terms, including: fixed or minimum quantities to be purchased; fixed, minimum
or variable price provisions; and the approximate timing of the transaction. Our open purchase orders are based on current inventory or
operational needs and are fulfilled by our vendors within short periods of time. We currently do not have minimum purchase commitments