Advance Auto Parts 2005 Annual Report Download - page 21
Download and view the complete annual report
Please find page 21 of the 2005 Advance Auto Parts annual report below. You can navigate through the pages in the report by either clicking on the pages listed below, or by using the keyword search tool below to find specific information within the annual report.-
 1
1 -
2
-
3
-
4
-
5
-
6
-
7
-
8
-
9
-
10
-
 11
11 -
 12
12 -
 13
13 -
 14
14 -
 15
15 -
 16
16 -
 17
17 -
 18
18 -
 19
19 -
 20
20 -
 21
21 -
 22
22 -
 23
23 -
 24
24 -
 25
25 -
 26
26 -
 27
27 -
 28
28 -
 29
29 -
 30
30 -
 31
31 -
32
-
33
-
34
-
35
-
36
-
37
-
38
-
39
-
40
-
41
-
42
-
43
-
44
-
45
-
46
-
47
-
48
-
49
-
50
-
51
-
52
-
53
-
54
-
55
-
56
-
57
-
58
-
59
-
60
-
61
-
62
-
63
-
64
-
65
-
66
-
67
-
68
 |
 |

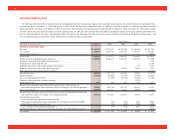
Fiscal Year(1)(2)
(in thousands, except per share data and ratios) 2005 2004 2003 2002 2001
Income from continuing operations before (loss) income on discontinued operations
and cumulative effect of a change in accounting principle per basic share(10) ............... $ 2.17 $ 1.70 $ 1.15 $ 0.59 $ 0.13
Income from continuing operations before (loss) income on discontinued operations
and cumulative effect of a change in accounting principle per diluted share(10)............. $ 2.13 $ 1.66 $ 1.12 $ 0.57 $ 0.13
Net income per basic share(10) ............................................................................................. $ 2.17 $ 1.70 $ 1.14 $ 0.62 $ 0.13
Net income per diluted share(10) .......................................................................................... $ 2.13 $ 1.66 $ 1.11 $ 0.60 $ 0.13
Weighted average basic shares outstanding(10) .................................................................... 108,318 110,846 109,499 105,147 85,911
Weighted average diluted shares outstanding(10) ................................................................. 109,987 113,222 112,115 108,564 87,474
Cash Flows Provided By (Used In):
Operating activities ............................................................................................................ $ 325,211 $ 263,794 $ 355,921 $ 242,996 $ 103,536
Investing activities.............................................................................................................. (302,780) (166,822) (85,474) (78,005) (451,008)
Financing activities............................................................................................................. (37,969) (52,138) (272,845) (169,223) 347,580
Balance Sheet and Other Financial Data:
Cash and cash equivalents.................................................................................................. $ 40,783 $ 56,321 $ 11,487 $ 13,885 $ 18,117
Inventory ............................................................................................................................ $1,367,099 $1,201,450 $1,113,781 $1,048,803 $ 982,000
Inventory turnover(11)........................................................................................................... 1.75 1.74 1.72 1.75 1.72
Inventory per store(12) .......................................................................................................... $ 476,009 $ 453,035 $ 438,669 $ 429,399 $ 392,635
Accounts payable to inventory ratio(13) ............................................................................... 54.8% 53.7% 51.0% 44.9% 43.7%
Net working capital(14) ......................................................................................................... $ 406,476 $ 416,302 $ 372,509 $ 462,896 $ 442,099
Capital expenditures(15)........................................................................................................ $ 216,214 $ 179,766 $ 101,177 $ 98,186 $ 63,695
Total assets ......................................................................................................................... $2,542,149 $2,201,962 $1,983,071 $1,965,225 $1,950,615
Total debt............................................................................................................................ $ 438,800 $ 470,000 $ 445,000 $ 735,522 $ 955,737
Total net debt(16) .................................................................................................................. $ 448,187 $ 433,863 $ 464,598 $ 722,506 $ 972,368
Total stockholders’ equity .................................................................................................. $ 919,771 $ 722,315 $ 631,244 $ 468,356 $ 288,571
Selected Store Data:
Comparable store sales growth(17) ....................................................................................... 8.7% 6.1% 3.1% 5.5% 6.2%
Number of stores at beginning of year............................................................................... 2,652 2,539 2,435 2,484 1,729
New stores ...................................................................................................................... 231 125 125 110 781
Closed stores(18) ............................................................................................................... (11) (12) (21) (159) (26)
Number of stores, end of period ........................................................................................ 2,872 2,652 2,539 2,435 2,484
Relocated stores ................................................................................................................. 54 34 32 39 18
Stores with commercial delivery program, end of period ................................................. 2,254 1,945 1,625 1,411 1,370
Total commercial sales, as a percentage of total sales....................................................... 21.8% 18.4% 15.8% 15.0% 16.8%
Total store square footage, end of period(19) ....................................................................... 20,899 19,734 18,875 18,108 18,717
Average net sales per store(20).............................................................................................. $ 1,551 $ 1,453 $ 1,379 $ 1,303 $ 1,346
Average net sales per square foot(21) ................................................................................... $ 208 $ 195 $ 186 $ 174 $ 175
Advance Auto Parts
I
Annual Report 2005
I
19