Advance Auto Parts 2005 Annual Report Download - page 60
Download and view the complete annual report
Please find page 60 of the 2005 Advance Auto Parts annual report below. You can navigate through the pages in the report by either clicking on the pages listed below, or by using the keyword search tool below to find specific information within the annual report.-
 1
1 -
2
-
3
-
4
-
5
-
6
-
7
-
8
-
9
-
10
-
11
-
12
-
13
-
14
-
15
-
16
-
17
-
18
-
19
-
20
-
21
-
22
-
23
-
24
-
25
-
26
-
27
-
28
-
29
-
30
-
31
-
32
-
33
-
34
-
35
-
36
-
37
-
38
-
39
-
40
-
41
-
42
-
43
-
44
-
45
-
46
-
47
-
48
-
49
-
 50
50 -
 51
51 -
 52
52 -
 53
53 -
 54
54 -
 55
55 -
 56
56 -
 57
57 -
 58
58 -
 59
59 -
 60
60 -
 61
61 -
 62
62 -
 63
63 -
 64
64 -
 65
65 -
 66
66 -
 67
67 -
 68
68
 |
 |

years 2005, 2004 and 2003, respectively. At December 31, 2005, there were 1,551 shares available to be issued
under the plan. Effective January 1, 2006, the plan was amended such that eligible Team Members may purchase
common stock at 95% of fair market value.
21. FAIR VALUE OF FINANCIAL INSTRUMENTS:
The carrying amount of cash and cash equivalents, receivables, bank overdrafts, accounts payable, borrowings
secured by receivables and current portion of long-term debt approximates fair value because of the short maturi-
ty of those instruments. The carrying amount for variable rate long-term debt approximates fair value for similar
issues available to the Company. The Company’s interest rate swaps are presented at fair value as stated in its
accounting policy on hedge activities (Note 2).
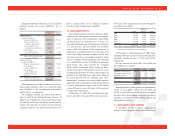
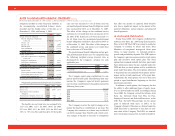
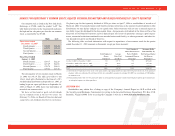
22. QUARTERLY FINANCIAL DATA (UNAUDITED):
The following table summarizes quarterly financial data for fiscal years 2005 and 2004:
2005 First Second Third Fourth
(16 weeks) (12 weeks) (12 weeks) (12 weeks)
Net sales......................................................................... $1,258,364 $1,023,146 $1,019,736 $963,725
Gross profit .................................................................... 600,931 482,050 481,415 450,082
Income from continuing operations............................... 68,647 65,929 60,793 39,356
Net income..................................................................... 68,647 65,929 60,793 39,356
Basic earning per share(2) ............................................... 0.64 0.61 0.56 0.36
Diluted earnings per share(2) ........................................... 0.63 0.60 0.55 0.36
2004(1) First Second Third Fourth
(16 weeks) (12 weeks) (12 weeks) (12 weeks)
Net sales......................................................................... $1,122,918 $908,412 $890,161 $848,806
Gross profit .................................................................... 520,898 422,302 416,515 393,656
Income from continuing operations............................... 51,343 53,229 51,399 32,056
(Loss) income on discontinued operations .................... (52) 6 (6) 13
Net income..................................................................... 51,291 53,235 51,393 32,069
Basic earnings per share(2) .............................................. 0.46 0.47 0.46 0.29
Diluted earnings per share(2) ........................................... 0.45 0.47 0.45 0.29
Note: Quarterly and year-to-date computations of per share amounts are made independently. Therefore, the sum of per share amounts for
the quarters may not agree with per share amounts for the year.
(1) The results of operations for the four quarters of fiscal 2004 reflect the reclassification of the wholesale operating results as discontin-
ued operations.
(2) Amounts reflect the effect of a 3-for-2 stock split of the Company’s common stock distributed on September 23, 2005.
58
NOTES TO CONSOLIDATED FINANCIAL STATEMENTS
(continued)
For the Years Ended December 31, 2005, January 1, 2005 and January 3, 2004 (in thousands, except per share data)