Advance Auto Parts 2005 Annual Report Download - page 50
Download and view the complete annual report
Please find page 50 of the 2005 Advance Auto Parts annual report below. You can navigate through the pages in the report by either clicking on the pages listed below, or by using the keyword search tool below to find specific information within the annual report.-
 1
1 -
2
-
3
-
4
-
5
-
6
-
7
-
8
-
9
-
10
-
11
-
12
-
13
-
14
-
15
-
16
-
17
-
18
-
19
-
20
-
21
-
22
-
23
-
24
-
25
-
26
-
27
-
28
-
29
-
30
-
31
-
32
-
33
-
34
-
35
-
36
-
37
-
38
-
39
-
 40
40 -
 41
41 -
 42
42 -
 43
43 -
 44
44 -
 45
45 -
 46
46 -
 47
47 -
 48
48 -
 49
49 -
 50
50 -
 51
51 -
 52
52 -
 53
53 -
 54
54 -
 55
55 -
 56
56 -
 57
57 -
 58
58 -
 59
59 -
 60
60 -
61
-
62
-
63
-
64
-
65
-
66
-
67
-
68
 |
 |

carrying balance represents the costs relating to
prices paid in prior years. The Company’s costs to
acquire inventory have been generally decreasing in
recent years as a result of its significant growth.
Accordingly, the cost to replace inventory is less than
the LIFO balances carried for similar product. The
Company recorded an increase in cost of sales of
$526 for fiscal year ended 2005 and reductions to
cost of sales of $11,212 and $2,156 for fiscal years
ended 2004 and 2003, respectively.
The remaining inventories are comprised of prod-
uct cores, which consist of the non-consumable por-
tion of certain parts and batteries and are valued
under the first-in, first-out (“FIFO”) method. Core
values are included as part of our merchandise costs
and are either passed on to the customer or returned
to the vendor. Additionally, these products are not
subject to the frequent cost changes like our other
merchandise inventory, thus, there is no material dif-
ference from applying either the LIFO or FIFO valu-
ation methods.
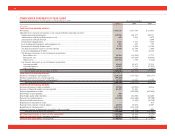
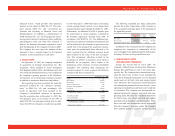
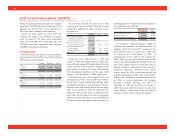
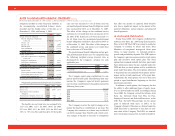
The Company capitalizes certain purchasing and
warehousing costs into inventory. Purchasing and
warehousing costs included in inventory, at FIFO, at
December 31, 2005 and January 1, 2005, were
$92,833 and $81,458, respectively. Inventories con-
sist of the following:
December 31, January 1,
2005 2005
Inventories at FIFO, net................... $1,294,310 $1,128,135
Adjustments to state inventories
at LIFO........................................ 72,789 73,315
Inventories at LIFO, net .................. $1,367,099 $1,201,450
Replacement cost approximated FIFO cost at
December 31, 2005 and January 1, 2005.
Inventory quantities are tracked through a perpetu-
al inventory system. The Company uses a cycle
counting program in all distribution centers, Parts
Delivered Quickly warehouses, or PDQ®s, Local
Area Warehouses, or LAWs, and retail stores to
ensure the accuracy of the perpetual inventory quan-
tities of both merchandise and core inventory. The
Company establishes reserves for estimated shrink
based on historical accuracy and effectiveness of the
cycle counting program. The Company also estab-
lishes reserves for potentially excess and obsolete
inventories based on current inventory levels of dis-
continued product and the historical analysis of the
liquidation of discontinued inventory below cost. The
nature of the Company’s inventory is such that the
risk of obsolescence is minimal and excess inventory
has historically been returned to the Company’s ven-
dors for credit. The Company provides reserves when
less than full credit is expected from a vendor or
when liquidating product will result in retail prices
below recorded costs. The Company’s reserves
against inventory for these matters were $22,825 and
$21,929 at December 31, 2005 and January 1, 2005,
respectively.
9. PROPERTY AND EQUIPMENT:
Property and equipment are stated at cost, less
accumulated depreciation and amortization. Expendi-
tures for maintenance and repairs are charged direct-
ly to expense when incurred; major improvements
are capitalized. When items are sold or retired, the
related cost and accumulated depreciation are
removed from the accounts, with any gain or loss
reflected in the consolidated statements of operations.
Depreciation of land improvements, buildings, fur-
niture, fixtures and equipment, and vehicles is pro-
vided over the estimated useful lives, which range
from 2 to 40 years, of the respective assets using the
straight-line method. Amortization of building and
leasehold improvements is provided over the shorter
of the original useful lives of the respective assets or
the term of the lease using the straight-line method.
The term of the lease is generally the initial term of
the lease unless external economic factors exist such
that renewals are reasonably assured in which case,
the renewal period would be included in the lease
term for purposes of establishing an amortization
period. Depreciation and amortization expense was
$119,938, $104,877 and $100,737 for the fiscal years
ended 2005, 2004 and 2003, respectively.
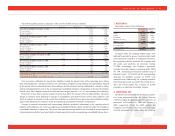
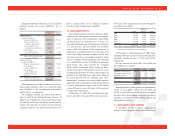
Property and equipment consists of the following:
Original December 31, January 1,
Useful Lives 2005 2005
Land and land
improvements........... 0 – 10 years $ 212,110 $ 187,624
Buildings....................... 40 years 295,699 240,447
Building and leasehold
improvements........... 10 – 40 years 159,568 133,415
Furniture, fixtures and
equipment................. 3 – 12 years 745,142 632,312
Vehicles......................... 2 – 10 years 35,339 32,963
Construction
in progress .................. 11,035 29,936
Other ............................. 4,516 4,335
1,463,409 1,261,032
Less – Accumulated
depreciation and
amortization ............. (564,558) (474,820)
Property and
equipment, net.......... $ 898,851 $ 786,212
The Company capitalized approximately $6,584,
$4,625 and $5,423 incurred for the development of
48
NOTES TO CONSOLIDATED FINANCIAL STATEMENTS
(continued)
For the Years Ended December 31, 2005, January 1, 2005 and January 3, 2004 (in thousands, except per share data)