Advance Auto Parts 2005 Annual Report Download - page 20
Download and view the complete annual report
Please find page 20 of the 2005 Advance Auto Parts annual report below. You can navigate through the pages in the report by either clicking on the pages listed below, or by using the keyword search tool below to find specific information within the annual report.-
 1
1 -
2
-
3
-
4
-
5
-
6
-
7
-
8
-
9
-
 10
10 -
 11
11 -
 12
12 -
 13
13 -
 14
14 -
 15
15 -
 16
16 -
 17
17 -
 18
18 -
 19
19 -
 20
20 -
 21
21 -
 22
22 -
 23
23 -
 24
24 -
 25
25 -
 26
26 -
 27
27 -
 28
28 -
 29
29 -
 30
30 -
31
-
32
-
33
-
34
-
35
-
36
-
37
-
38
-
39
-
40
-
41
-
42
-
43
-
44
-
45
-
46
-
47
-
48
-
49
-
50
-
51
-
52
-
53
-
54
-
55
-
56
-
57
-
58
-
59
-
60
-
61
-
62
-
63
-
64
-
65
-
66
-
67
-
68
 |
 |
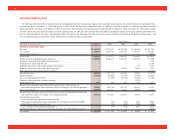
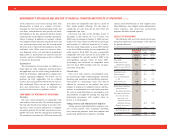
SELECTED FINANCIAL DATA
The following table sets forth our selected historical consolidated statement of operations, balance sheet and other operating data. The selected historical consolidated finan-
cial and other data at December 31, 2005 and January 1, 2005 and for the three years ended December 31, 2005 have been derived from our audited consolidated financial
statements and the related notes included elsewhere in this report. The historical consolidated financial and other data at January 3, 2004, December 28, 2002 and December
29, 2001 and for the years ended December 28, 2002 and December 29, 2001 have been derived from our audited consolidated financial statements and the related notes that
have not been included in this report. You should read this data along with “Management’s Discussion and Analysis of Financial Condition and Results of Operations,” and
our consolidated financial statements and the related notes included elsewhere in this report.
Fiscal Year(1)(2)
(in thousands, except per share data) 2005 2004 2003 2002 2001
Statement of Operations Data:
Net sales ............................................................................................................................. $4,264,971 $3,770,297 $3,493,696 $3,204,140 $2,419,746
Cost of sales ....................................................................................................................... 2,250,493 2,016,926 1,889,178 1,769,733 1,357,594
Supply chain initiatives(3) .................................................................................................... —— — — 9,099
Gross profit ........................................................................................................................ 2,014,478 1,753,371 1,604,518 1,434,407 1,053,053
Selling, general and administrative expenses(4) .................................................................. 1,605,986 1,424,613 1,305,867 1,202,524 938,300
Expenses associated with supply chain initiatives(5)........................................................... —— — — 1,394
Impairment of assets held for sale(6) ................................................................................... —— — — 12,300
Expenses associated with merger related restructuring(7) ................................................... —— — 597 3,719
Expenses associated with merger and integration(8) ........................................................... —— 10,417 34,935 1,135
Non-cash stock option compensation expense(9) ................................................................ —— — — 11,735
Operating income ............................................................................................................... 408,492 328,758 288,234 196,351 84,470
Interest expense.................................................................................................................. (32,384) (20,069) (37,576) (77,081) (61,042)
Loss on extinguishment of debt ......................................................................................... —(3,230) (47,288) (16,822) (6,106)
Expenses associated with secondary offering.................................................................... —— — (1,733) —
Other income, net............................................................................................................... 2,815 289 341 963 1,033
Income from continuing operations before income taxes, (loss) income on
discontinued operations and cumulative effect of a change in accounting principle..... 378,923 305,748 203,711 101,678 18,355
Income tax expense............................................................................................................ 144,198 117,721 78,424 39,530 7,284
Income from continuing operations before (loss) income on discontinued operations
and cumulative effect of a change in accounting principle............................................ 234,725 188,027 125,287 62,148 11,071
Discontinued operations:
(Loss) income from operations of discontinued
Wholesale Distribution Network (including loss on disposal of $2,693 in 2003)......... —(63) (572) 4,691 4,040
(Benefit) provision for income taxes.............................................................................. —(24) (220) 1,820 1,604
(Loss) income on discontinued operations..................................................................... —(39) (352) 2,871 2,436
Cumulative effect of a change in accounting principle, net of $1,360 income taxes........ — — — — (2,065)
Net income ......................................................................................................................... $ 234,725 $ 187,988 $ 124,935 $ 65,019 $ 11,442
18