Advance Auto Parts 2005 Annual Report Download - page 24
Download and view the complete annual report
Please find page 24 of the 2005 Advance Auto Parts annual report below. You can navigate through the pages in the report by either clicking on the pages listed below, or by using the keyword search tool below to find specific information within the annual report.-
 1
1 -
2
-
3
-
4
-
5
-
6
-
7
-
8
-
9
-
10
-
11
-
12
-
13
-
 14
14 -
 15
15 -
 16
16 -
 17
17 -
 18
18 -
 19
19 -
 20
20 -
 21
21 -
 22
22 -
 23
23 -
 24
24 -
 25
25 -
 26
26 -
 27
27 -
 28
28 -
 29
29 -
 30
30 -
 31
31 -
 32
32 -
 33
33 -
 34
34 -
35
-
36
-
37
-
38
-
39
-
40
-
41
-
42
-
43
-
44
-
45
-
46
-
47
-
48
-
49
-
50
-
51
-
52
-
53
-
54
-
55
-
56
-
57
-
58
-
59
-
60
-
61
-
62
-
63
-
64
-
65
-
66
-
67
-
68
 |
 |

margin improvements. These results helped us generate
strong cash flow and drive a higher return on our
invested capital. Our strong sales were primarily driven
by an 8.7% increase in comparable store net sales for
the year, our highest comparative sales increase as a
public company. Additionally, our average net sales
per store rose to more than $1.5 million, which is one
of the highest among our major competitors.
We remain focused on the following four goals:
1. Raising average sales per store;
2. Expanding operating margins;
3. Generating strong free cash flow; and
4. Increasing return on invested capital.
We believe our 2005 results also reflect the
progress made on the following key initiatives that
focus specifically on driving higher sales per store
and leveraging our fixed expenses:
• Improving store execution towards “best in class”
in automotive aftermarket retail;
• Continued execution of our category management
program;
• Continued implementation of our 2010 store
remodeling program, now resulting in more than
50% of our chain remodeled;
• Our focus on making our supply chain more
responsive and improving our in-stock position;
• Consistent growth and execution of our
commercial program;
• Our focus on recruiting, training and retaining
high-performing Team Members, especially those
who are ASE-certified and/or bilingual; and
• Enhanced national advertising.
Beyond the implementation of our key business
initiatives, various conditions that impact our indus-
try continue to remain strong. The number of regis-
tered vehicles on the road is at an all time high and
continues to increase. The average age of vehicles
also continues to increase and is now over nine years
old. Additionally, technological changes in newer
models and the shift from cars to light trucks and
sport utility vehicles have resulted in more expensive
replacement parts for these vehicles. We believe the
combination of our execution on key business initia-
tives and favorable industry dynamics will continue
to drive our earnings per share growth into the fore-
seeable future.
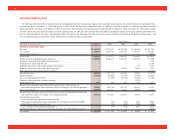
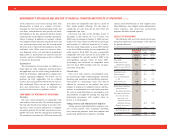
The following table highlights certain operating
results and key metrics for 2005, 2004 and 2003:
Fiscal Year
2005 2004 2003(1)
Total net sales
(in thousands)........... $4,264,971 $3,770,297 $3,493,696
Total commercial net
sales (in thousands).. $ 931,320 $ 693,449 $ 553,003
Comparable store net
sales growth........... 8.7% 6.1% 3.1%
DIY comparable store
net sales growth..... 4.8% 2.8% 2.4%
DIFM comparable
store net sales
growth.................... 25.2% 22.9% 7.2%
Average net sales per
store (in thousands).. $ 1,551 $ 1,453 $ 1,379
Inventory per store
(in thousands)........... $ 476,009 $ 453,035 $ 438,669
Inventory turnover ..... 1.75 1.74 1.72
Gross margin.............. 47.2% 46.5% 45.9%
Operating margin....... 9.6% 8.7% 8.3%
Note: These metrics should be reviewed along with the footnotes
to the table setting forth our selected store data in “Selected
Financial Data” located elsewhere in this report. The footnotes
contain descriptions regarding the calculation of these metrics.
(1) All financial metrics for 2003 include the 53rd week, except
the average net sales per store and inventory turnover metrics.
KEY 2005 EVENTS
The following key events occurred during 2005:
• Began servicing stores from our new Northeast
distribution center;
• Acquired substantially all of the assets of Lappen
Auto Supply;
• Completed the acquisition of Autopart
International, Inc.;
• Commenced a new $300 million stock repurchase
program authorized by our Board of Directors;
• Effected a 3-for-2 stock split in the form of a 50%
stock dividend;
• Suffered structural damages and disruptions created
by three major hurricanes – Katrina, Rita and
Wilma; and
• Completed the physical conversion of our Florida
stores acquired from Discount Auto Parts.
Acquisitions
On September 14, 2005, we completed the acqui-
sition of Autopart International, Inc., or AI. The
acquisition, which included 61 stores throughout
New England and New York, a distribution center
and AI’s wholesale distribution business, will com-
plement our growing presence in the Northeast. AI’s
business serves the growing commercial market in
addition to warehouse distributors and jobbers. The
acquisition has been accounted for under the pur-
chase method of accounting. Accordingly, AI’s
results of operations have been included in our con-
solidated statement of operations since the acquisi-
tion date. The purchase price of $87.4 million, inclu-
sive of contingent consideration of $12.5 million
payable no later than April 1, 2006 based upon AI
satisfying certain earnings before interest, taxes,
depreciation and amortization targets met through
December 31, 2005, has been allocated to the assets
MANAGEMENT’S DISCUSSION AND ANALYSIS OF FINANCIAL CONDITION AND RESULTS OF OPERATIONS
(continued)
22