Advance Auto Parts 2005 Annual Report Download - page 28
Download and view the complete annual report
Please find page 28 of the 2005 Advance Auto Parts annual report below. You can navigate through the pages in the report by either clicking on the pages listed below, or by using the keyword search tool below to find specific information within the annual report.-
 1
1 -
2
-
3
-
4
-
5
-
6
-
7
-
8
-
9
-
10
-
11
-
12
-
13
-
14
-
15
-
16
-
17
-
 18
18 -
 19
19 -
 20
20 -
 21
21 -
 22
22 -
 23
23 -
 24
24 -
 25
25 -
 26
26 -
 27
27 -
 28
28 -
 29
29 -
 30
30 -
 31
31 -
 32
32 -
 33
33 -
 34
34 -
 35
35 -
 36
36 -
 37
37 -
 38
38 -
39
-
40
-
41
-
42
-
43
-
44
-
45
-
46
-
47
-
48
-
49
-
50
-
51
-
52
-
53
-
54
-
55
-
56
-
57
-
58
-
59
-
60
-
61
-
62
-
63
-
64
-
65
-
66
-
67
-
68
 |
 |

not be sufficient to recover the carrying value. This
determination is based on a number of factors,
including the store’s historical operating results and
cash flows, estimated future sales growth, real estate
development in the area and perceived local market
conditions that can be difficult to predict and may be
subject to change. In addition, we regularly evaluate
our computer-related and other long-lived assets and
may accelerate depreciation over the revised useful
life if the asset is expected to be replaced or has lim-
ited future value. When assets are retired or other-
wise disposed of, the cost and related accumulated
depreciation or amortization are removed from the
accounts, and any resulting gain or loss is reflected
in income for that period.
Tax Reserves
The determination of our income tax liabilities is
based upon the code, regulations, pronouncements
and applicable case law of the taxing jurisdictions in
which we do business. Applying these complex rules
requires significant judgment. We believe our tax
positions are fully supportable, but we establish
reserves for certain positions which may be success-
fully challenged. These reserves are adjusted, on a
facts and circumstances basis, as challenges are
resolved or the relevant tax guidance evolves.
COMPONENTS OF STATEMENT OF OPERATIONS
Net Sales
Net sales consist primarily of comparable store
sales and new store net sales. We calculate compara-
ble store sales based on the change in net sales start-
ing once a store has been opened for 13 complete
accounting periods. We include relocations in com-
parable store sales from the original date of opening.
We exclude net sales from the 36 Western Auto retail
stores from our comparable store sales as a result of
their unique product offerings. We also plan to
exclude the net sales from the AI stores from our
comparable store sales.
Our fiscal year ends on the Saturday closest to
December 31 and consists of 52 or 53 weeks. Our
2004 fiscal year began on January 4, 2004 and con-
sisted of 52 weeks, while our 2003 fiscal year began
on December 29, 2002 and consisted of 53 weeks.
The extra week of operations in fiscal 2003 resulted
in our fiscal 2004 consisting of non-comparable cal-
endar weeks to fiscal 2003. To create a meaningful
comparable store sales measure for fiscal 2004, we
have compared the calendar weeks of 2004 to the
corresponding calendar weeks of fiscal 2003.
Accordingly, our calculation of comparable stores
sales for fiscal 2004 excludes week one of opera-
tions from fiscal 2003.
Cost of Sales
Our cost of sales consists of merchandise costs,
net of incentives under vendor programs, inventory
shrinkage and warehouse and distribution expenses.
Gross profit as a percentage of net sales may be
affected by variations in our product mix, price
changes in response to competitive factors and fluc-
tuations in merchandise costs and vendor programs.
We seek to avoid fluctuation in merchandise costs
and instability of supply by entering into long-term
purchasing agreements with vendors when we
believe it is advantageous.
Selling, General and Administrative Expenses
Selling, general and administrative expenses con-
sist of store payroll, store occupancy (including
rent), advertising expenses, other store expenses and
general and administrative expenses, including
salaries and related benefits of store support center
Team Members, store support center administrative
office expenses, data processing, professional
expenses and other related expenses.
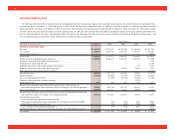
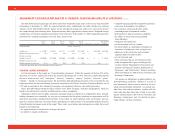
RESULTS OF OPERATIONS
The following table sets forth certain of our oper-
ating data expressed as a percentage of net sales for
the periods indicated:
Fiscal Year Ended
December 31, January 1, January 3,
2005 2005 2004
Net sales ............................. 100.0% 100.0% 100.0%
Cost of sales ....................... 52.8 53.5 54.1
Gross profit ........................ 47.2 46.5 45.9
Selling, general and
administrative expenses .. 37.6 37.8 37.3
Expenses associated with
merger and integration.... —— 0.3
Operating income............... 9.6 8.7 8.3
Interest expense.................. (0.7) (0.5) (1.1)
Loss on extinguishment
of debt............................ —(0.1) (1.4)
Other income, net............... (0.0) 0.0 0.0
Income tax expense............ 3.4 3.1 2.2
Income from continuing
operations before
discontinued operations .. 5.5 5.0 3.6
Discontinued operations:
(Loss) income from
operations of dis-
continued wholesale
distribution network ... —(0.0) (0.0)
(Benefit) provision for
income taxes.............. —(0.0) (0.0)
(Loss) income on dis-
continued operations .. —(0.0) (0.0)
Net income ......................... 5.5% 5.0% 3.6%
MANAGEMENT’S DISCUSSION AND ANALYSIS OF FINANCIAL CONDITION AND RESULTS OF OPERATIONS
(continued)
26