Advance Auto Parts 2005 Annual Report Download - page 29
Download and view the complete annual report
Please find page 29 of the 2005 Advance Auto Parts annual report below. You can navigate through the pages in the report by either clicking on the pages listed below, or by using the keyword search tool below to find specific information within the annual report.-
 1
1 -
2
-
3
-
4
-
5
-
6
-
7
-
8
-
9
-
10
-
11
-
12
-
13
-
14
-
15
-
16
-
17
-
18
-
 19
19 -
 20
20 -
 21
21 -
 22
22 -
 23
23 -
 24
24 -
 25
25 -
 26
26 -
 27
27 -
 28
28 -
 29
29 -
 30
30 -
 31
31 -
 32
32 -
 33
33 -
 34
34 -
 35
35 -
 36
36 -
 37
37 -
 38
38 -
 39
39 -
40
-
41
-
42
-
43
-
44
-
45
-
46
-
47
-
48
-
49
-
50
-
51
-
52
-
53
-
54
-
55
-
56
-
57
-
58
-
59
-
60
-
61
-
62
-
63
-
64
-
65
-
66
-
67
-
68
 |
 |

Advance Auto Parts
I
Annual Report 2005
I
27
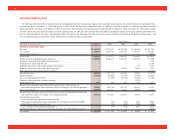
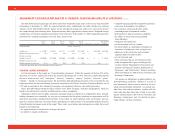
Fiscal 2005 Compared to Fiscal 2004
Net sales for 2005 were $4,265.0 million, an
increase of $494.7 million, or 13.1%, over net sales
for 2004. The net sales increase was due to an
increase in comparable store sales of 8.7%, contribu-
tions from the 151 new stores opened within the last
year and sales from acquired operations. The compa-
rable store sales increase was driven by an increase in
average ticket sales and a slight increase in customer
traffic. We believe these results reflect the execution
of the key business initiatives discussed previously in
the Management Overview section. In addition, we
believe our DIFM sales have increased as a result of
the continued execution of our commercial plan as dis-
cussed previously in the Commercial Program section.
Gross profit for 2005 was $2,014.5 million, or
47.2% of net sales, as compared to $1,753.4 million,
or 46.5% of net sales, in 2004. The increase in gross
profit as a percentage of sales reflects continued
benefits realized from our category management
program in the form of better margins on key product
categories and increased incentives under our vendor
programs and supply chain efficiencies.
Selling, general and administrative expenses were
$1,606.0 million, or 37.6% of net sales for 2005, as
compared to $1,424.6 million, or 37.8% of net sales
for 2004. For fiscal 2005, we experienced a decrease
in selling, general and administrative expenses as a
percentage of net sales resulting from our ability to
leverage our strong comparable store sales and lower
self-insurance expense partially offset by higher fuel
and energy costs.
Interest expense for 2005 was $32.4 million, or
0.7% of net sales, as compared to $20.1 million, or
0.5% of net sales, in 2004. The increase in interest
expense is a result of both higher average outstand-
ing debt levels and borrowing rates as compared to
fiscal 2004.
Income tax expense for 2005 was $144.2 million,
as compared to $117.7 million for 2004. This in-
crease in income tax expense primarily reflects our
higher earnings. Our effective income tax rate was
38.1% and 38.5% for 2005 and 2004, respectively.
We recorded net income of $234.7 million, or
$2.13 per diluted share for 2005, as compared to
$188.0 million, or $1.66 per diluted share for 2004. As
a percentage of sales, net income for 2005 was 5.5%,
as compared to 5.0% for 2004. The earnings per share
results reflect the effect of a 3-for-2 stock split of our
common stock distributed on September 23, 2005.
Fiscal 2004 Compared to Fiscal 2003
Net sales for 2004 were $3,770.3 million, an
increase of $276.6 million, or 7.9%, over net sales for
2003. Excluding the effect of the 53rd week for 2003
our net sales increased $339.6 million, or 9.9%, over
net sales for 2003. The net sales increase was due to
an increase in comparable store sales of 6.1% and
contributions from our 125 new stores opened during
fiscal 2004. The comparable store sales increase was
primarily the result of increases in both customer
traffic and average ticket sales. Overall, we believe
our 2010 store format, category management and
enhanced nationwide advertising program drove our
growth in net sales. In addition, we believe our DIFM
sales have increased as a result of the continued exe-
cution of our commercial delivery programs in our
existing markets and our continued focus on a high
level of service to our DIFM customers.
Gross profit for 2004 was $1,753.4 million, or
46.5% of net sales, as compared to $1,604.5 million,
or 45.9% of net sales, in 2003. The increase in gross
profit as a percentage of sales reflect continued ben-
efits realized from our category management initia-
tives and reduced inventory shrinkage.
Selling, general and administrative expenses
increased to $1,424.6 million, or 37.8% of net sales
for 2004, from $1,316.3 million, or 37.6% of net
sales for 2003. The increase in selling, general and
administrative expenses as a percentage of net sales
in 2004 was primarily a result of increased expenses
associated with our self-insurance programs, includ-
ing the increased costs required to close claims
below our stop-loss limits and increased medical
costs for covered Team Members due to inflation in
the health care sector. Selling, general and adminis-
trative expenses for 2003 included $10.4 million in
merger and integration expenses related to the inte-
gration of Discount. These integration expenses
were related to, among other things, overlapping
administrative functions and store conversion
expenses. Excluding the merger and integration
expenses from 2003, selling, general and administra-
tive expenses were 37.3% of net sales.
Interest expense for 2004 was $20.1 million, or
0.5% of net sales, as compared to $37.6 million, or
1.1% of net sales, in 2003. The decrease in interest
expense is a result of lower overall interest rates due
primarily to our redemption of our outstanding senior
subordinated notes and senior discount debentures in
the first quarter of fiscal 2003. Additionally, the
decrease resulted from lower average outstanding debt
levels on our senior credit facility throughout fiscal
2004 as compared to fiscal 2003.