Acer 2005 Annual Report Download - page 81
Download and view the complete annual report
Please find page 81 of the 2005 Acer annual report below. You can navigate through the pages in the report by either clicking on the pages listed below, or by using the keyword search tool below to find specific information within the annual report.-
 1
1 -
2
-
3
-
4
-
5
-
6
-
7
-
8
-
9
-
10
-
11
-
12
-
13
-
14
-
15
-
16
-
17
-
18
-
19
-
20
-
21
-
22
-
23
-
24
-
25
-
26
-
27
-
28
-
29
-
30
-
31
-
32
-
33
-
34
-
35
-
36
-
37
-
38
-
39
-
40
-
41
-
42
-
43
-
44
-
45
-
46
-
47
-
48
-
49
-
50
-
51
-
52
-
53
-
54
-
55
-
56
-
57
-
58
-
59
-
60
-
61
-
62
-
63
-
64
-
65
-
66
-
67
-
68
-
69
-
70
-
 71
71 -
 72
72 -
 73
73 -
 74
74 -
 75
75 -
 76
76 -
 77
77 -
 78
78 -
 79
79 -
 80
80 -
 81
81 -
 82
82 -
 83
83 -
 84
84 -
 85
85 -
 86
86 -
 87
87 -
 88
88 -
 89
89
 |
 |

- 76 -
2005
Taiwan
North
America
Europe
Other
Eliminations
Consolidated
NT$ NT$ NT$ NT$ NT$ NT$
Area income:
Customers 82,646,021 37,202,548 162,313,255 46,573,875 - 328,735,699
Inter-company 176,533,231 259,407 7,562,674 112,452 (184,467,764) -
259,179,252 37,461,955 169,875,929 46,686,327 (184,467,764) 328,735,699
Investment income 1,373,113
Gain on disposal of
investments
5,716,103
Total income 335,824,915
Area profit (loss)
before income taxes
(1,668,089)
14,695
6,426,204
538,403
134,082 5,445,295
Net investment income (42,179)
Gain on disposal of
investments, net
5,634,709
Interest expense (385,293)
Consolidated income
before income taxes
10,652,532
Area identifiable assets 104,803,596 9,530,223 52,935,838 17,108,778 (26,422,588) 157,955,847
Long-term investments 13,299,186
Goodwill 306,616
Total assets 171,561,649
Depreciation and
amortization
1,127,382
32,112
172,162
164,638
-
1,496,294
Capital expenditures 212,909 11,605 175,088 105,795 - 505,397
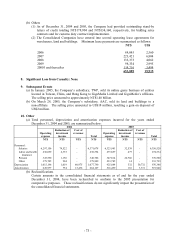
(c) Export sales
Export sales of the Company and its domestic subsidiaries for the years ended December 31,
2004 and 2005, are summarized below:
2004 2005
Sales to: NT$ NT$ US$
North America 1,373,378 3,083,505 93,909
Europe 15,575,912 14,725,204 448,461
Other 3,843,866 3,540,829 107,837
20,793,156 21,349,538 650,207
(d) Major customers
There were no individual customers representing greater than 10% of consolidated revenue for
the years ended December 31, 2004 and 2005.