Acer 2005 Annual Report Download - page 46
Download and view the complete annual report
Please find page 46 of the 2005 Acer annual report below. You can navigate through the pages in the report by either clicking on the pages listed below, or by using the keyword search tool below to find specific information within the annual report.-
 1
1 -
2
-
3
-
4
-
5
-
6
-
7
-
8
-
9
-
10
-
11
-
12
-
13
-
14
-
15
-
16
-
17
-
18
-
19
-
20
-
21
-
22
-
23
-
24
-
25
-
26
-
27
-
28
-
29
-
30
-
31
-
32
-
33
-
34
-
35
-
 36
36 -
 37
37 -
 38
38 -
 39
39 -
 40
40 -
 41
41 -
 42
42 -
 43
43 -
 44
44 -
 45
45 -
 46
46 -
 47
47 -
 48
48 -
 49
49 -
 50
50 -
 51
51 -
 52
52 -
 53
53 -
 54
54 -
 55
55 -
 56
56 -
57
-
58
-
59
-
60
-
61
-
62
-
63
-
64
-
65
-
66
-
67
-
68
-
69
-
70
-
71
-
72
-
73
-
74
-
75
-
76
-
77
-
78
-
79
-
80
-
81
-
82
-
83
-
84
-
85
-
86
-
87
-
88
-
89
 |
 |

- 41 -
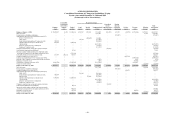
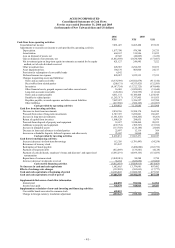
ACER INCORPORATED
Consolidated Statements of Cash Flows
For the years ended December 31, 2004 and 2005
(in thousands of New Taiwan dollars and US dollars)
2004 2005
NT$ NT$ US$
Cash flows from operating activities:
Consolidated net income 7,091,423 8,465,488 257,819
Adjustments to reconcile net income to cash provided by operating activities:
Depreciation 1,077,790 976,348 29,735
Amortization 664,167 519,946 15,835
Loss on disposal of assets, net 47,643 (46,605) (1,419)
Gain on disposal of investments, net (5,432,389) (5,634,709) (171,607)
Net investment gain on long-term equity investments accounted for by equity
method, net of cash dividends received
421,127 246,985 7,522
Other investment loss 628,587 2,294,293 69,873
Asset impairment loss 184,178 805,000 24,517
Provision for redemption of convertible bonds 6,542 - -
Deferred income tax expense 820,057 1,222,533 37,233
Changes in operating assets and liabilities:
Notes and accounts receivable (8,374,939) (29,922,879) (911,310)
Receivables from related parties (200,131) (4,353,425) (132,585)
Inventories (4,187,754) (15,722,725) (478,840)
Other financial assets, prepaid expenses and other current assets 16,065 (1,039,041) (31,644)
Long-term accounts receivable (120,436) (366,555) (11,164)
Notes and accounts payable 4,011,172 41,186,404 1,254,345
Payables to related parties (1,283,317) 5,317,805 161,955
Royalties payable, accrued expenses and other current liabilities 7,087,227 3,536,327 107,700
Other liabilities (417,560) (360,105) (10,967)
Cash provided by operating activities 2,039,452 7,125,085 216,998
Cash flow from investing activities:
Decrease in short-term investments 2,834,536 11,958,174 364,190
Proceeds from sales of long-term investments 6,707,723 5,269,601 160,487
Increase in long-term investments (1,561,520) (304,205) (9,265)
Return of capital from investees 1,008,128 294,835 8,979
Proceeds from disposal of property and equipment 18,637 3,248,469 98,933
Additions to property and equipment (472,734) (505,397) (15,392)
Increase in intangible assets (117,703) (126,186) (3,843)
Decrease in loans and advances to related parties 22,897 12,116 369
Increase in refundable deposits, deferred expenses and other assets 25,867 16,064 489
Cash provided by investing activities 8,465,831 19,863,471 604,947
Cash flows from financing activities:
Increase (decrease) in short-term borrowings 112,356 (1,781,443) (54,254)
Reissuance of treasury stock 335,247 - -
Redemption of bonds payable - (6,000,000) (182,732)
Payment of long-term debt (412,069) (135,541) (4,128)
Payment of cash dividends, employee’ s bonus and directors’ and supervisors’
remuneration
(5,035,291) (4,959,163) (151,033)
Repurchase of common stock (3,849,015) 90,288 2,750
Increase (decrease) in deposits received 36,154 (823,056) (25,066)
Cash used in financing activities (8,812,618) (13,608,915) (414,463)
Net increase in cash and cash equivalents 1,692,665 13,379,641 407,482
Effects of exchange rate changes (132,003) (583,693) (17,777)
Cash and cash equivalents at beginning of period 14,126,043 15,686,705 477,743
Cash and cash equivalents at end of period 15,686,705 28,482,653 867,448
Supplemental disclosures of cash flow information
Interest paid 602,059 556,946 16,962
Income taxes paid 743,379 928,813 28,287
Supplementary schedules of non-cash investing and financing activities:
Convertible bonds converted to common stock 685,023 - -
Change in foreign currency translation adjustment (359,247) (359,322) (10,943)