Acer 2005 Annual Report Download - page 20
Download and view the complete annual report
Please find page 20 of the 2005 Acer annual report below. You can navigate through the pages in the report by either clicking on the pages listed below, or by using the keyword search tool below to find specific information within the annual report.-
 1
1 -
2
-
3
-
4
-
5
-
6
-
7
-
8
-
9
-
 10
10 -
 11
11 -
 12
12 -
 13
13 -
 14
14 -
 15
15 -
 16
16 -
 17
17 -
 18
18 -
 19
19 -
 20
20 -
 21
21 -
 22
22 -
 23
23 -
 24
24 -
 25
25 -
 26
26 -
 27
27 -
 28
28 -
 29
29 -
 30
30 -
31
-
32
-
33
-
34
-
35
-
36
-
37
-
38
-
39
-
40
-
41
-
42
-
43
-
44
-
45
-
46
-
47
-
48
-
49
-
50
-
51
-
52
-
53
-
54
-
55
-
56
-
57
-
58
-
59
-
60
-
61
-
62
-
63
-
64
-
65
-
66
-
67
-
68
-
69
-
70
-
71
-
72
-
73
-
74
-
75
-
76
-
77
-
78
-
79
-
80
-
81
-
82
-
83
-
84
-
85
-
86
-
87
-
88
-
89
 |
 |
- 15 -
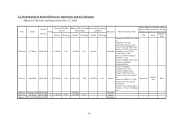
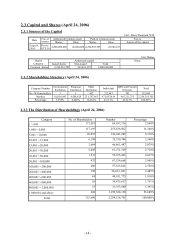
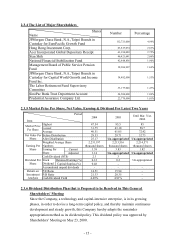
2.3.4 The List of Major Shareholders
Shares
Name Number Percentage
JPMorgan Chase Bank, N.A.,Taipei Branch in
Custoday for EuroPacific Growth Fund 112,721,000 4.99%
Hong Rong Investment Corp. 63,817,074 2.83%
Acer Incorporated Global Depositary Receipt 61,934,089 2.75%
Stan Shih 46,421,641 2.06%
National Financial Stabilization Fund 42,848,856 1.90%
Management Board of Public Service Pension
Fund 38,206,907 1.69%
JPMorgan Chase Bank, N.A.,Taipei Branch in
Custoday for Capital World Growth and Income
Fund Inc.
34,482,000 1.53%
The Labor Retirement Fund Supervisory
Committee 33,177,048 1.47%
SinoPac Bank Trust Department Account 24,500,000 1.09%
Prudential Assurance Company Ltd. 22,770,000 1.01%
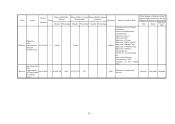
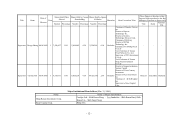
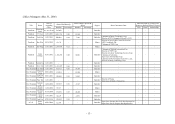
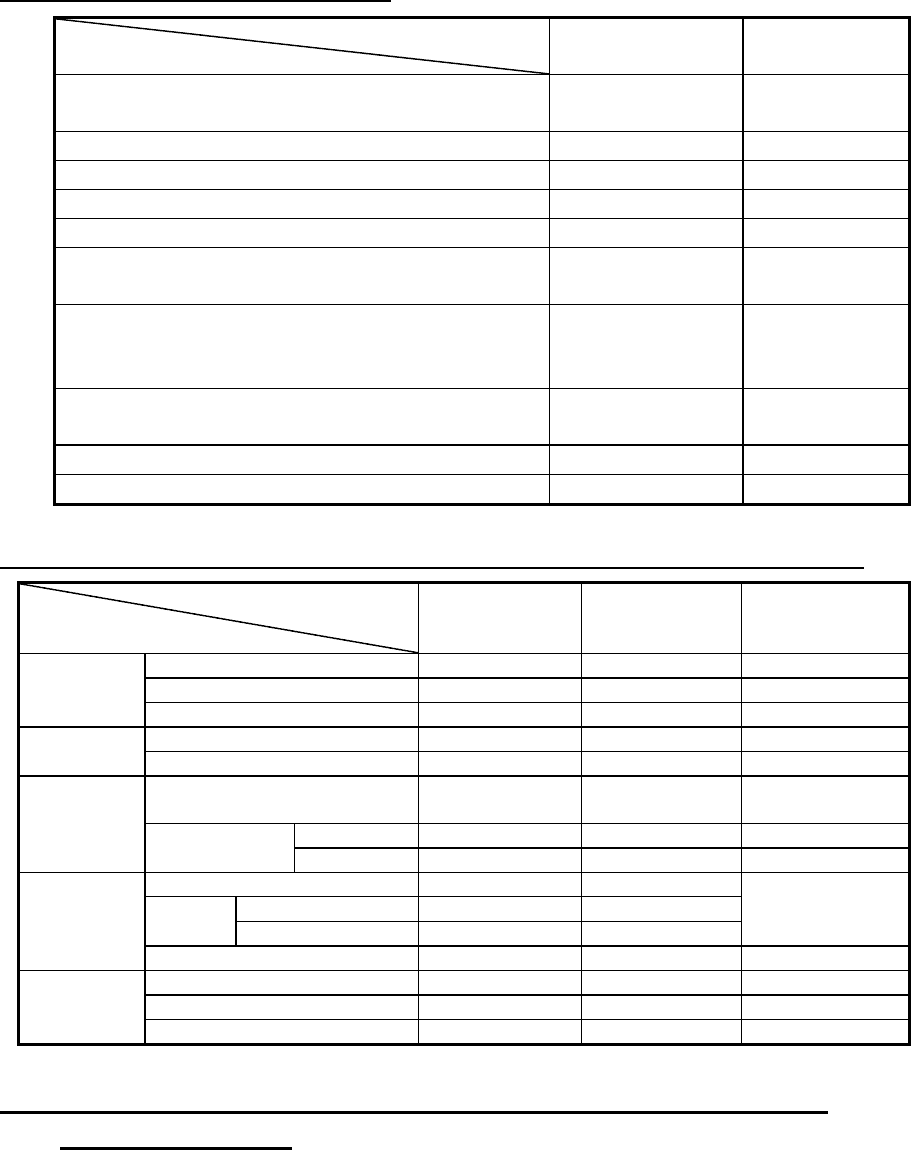
2.3.5 Market Price Per Share, Net Value, Earning & Dividend For Latest Two Years
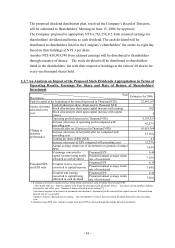
2.3.6 Dividend Distribution Plan that is Proposed to be Resolved in This General
Shareholders’ Meeting
Since the Company, a technology and capital-intensive enterprise, is in its growing
phases, in order to devise a long-term capital policy, and thereby maintain continuous
development and steady growth, this Company hereby adopts the remainder
appropriation method as its dividend policy. This dividend policy was approved by
Shareholders’ Meeting on May 23, 2000.
Period
Item
2004 2005
Until Mar. 31st,
2006
Highest 47.54 85.5 85
Lowest 31.75 43.18 58.7
Market Price
Per Share Average 40.51 61.05 72.42
Before Distribution 29.53 29.71 32.73 Net Value Per
Share After Distribution 25.17 Un-appropriated Un-appropriated
Weighted Average Share
Numbers
2,231,197
thousand shares
2,213,516
thousand shares
2,214,571
thousand shares
Current 3.38 3.83 1.82
Earning Per
Share Earning Per
Share Adjusted 3.14
Un-appropriated Un-appropriated
Cash Dividend (NT$) 2.3 3
Retained Earning (%) 0.12 0.2 Stock
Dividend Capital Surplus (%) 0.48 -
Un-appropriated
Dividend Per
Share
Accumulated unpaid dividends - - -
P/E Ratio 14.51 15.94 -
P/D Ratio 21.33 20.35 -
Return on
Investment
Analysis Cash Dividend Yield 4.69% 4.91% -