Acer 2005 Annual Report Download - page 80
Download and view the complete annual report
Please find page 80 of the 2005 Acer annual report below. You can navigate through the pages in the report by either clicking on the pages listed below, or by using the keyword search tool below to find specific information within the annual report.-
 1
1 -
2
-
3
-
4
-
5
-
6
-
7
-
8
-
9
-
10
-
11
-
12
-
13
-
14
-
15
-
16
-
17
-
18
-
19
-
20
-
21
-
22
-
23
-
24
-
25
-
26
-
27
-
28
-
29
-
30
-
31
-
32
-
33
-
34
-
35
-
36
-
37
-
38
-
39
-
40
-
41
-
42
-
43
-
44
-
45
-
46
-
47
-
48
-
49
-
50
-
51
-
52
-
53
-
54
-
55
-
56
-
57
-
58
-
59
-
60
-
61
-
62
-
63
-
64
-
65
-
66
-
67
-
68
-
69
-
 70
70 -
 71
71 -
 72
72 -
 73
73 -
 74
74 -
 75
75 -
 76
76 -
 77
77 -
 78
78 -
 79
79 -
 80
80 -
 81
81 -
 82
82 -
 83
83 -
 84
84 -
 85
85 -
 86
86 -
 87
87 -
 88
88 -
 89
89
 |
 |

- 75 -
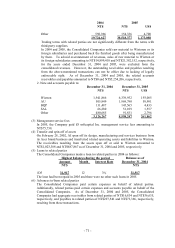
Long-term investments accounted for by the equity method in which the investee has a
vertical relationship with the information technology products segment of the Company are
listed below:
Investee Year Book value of long-term
investment
Investment income (loss)
NT$ NT$
Wistron (Taiwan) 2005 6,075,929 1,188,970
2004 6,546,120 (347,816)
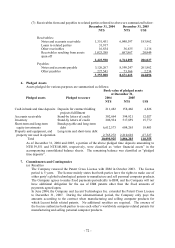
(b) Geographic information
Information by geographic area as of and the years ended December 31, 2004 and 2005, is as
follows:
2004
Taiwan
North
America
Europe
Other
Eliminations
Consolidated
NT$ NT$ NT$ NT$ NT$ NT$
Area income:
Customers 61,110,095 16,497,233 118,681,411 36,151,817 - 232,440,556
Inter-company 115,281,193 429,026 5,694,500 66,792 (121,471,511) -
176,391,288 16,926,259 124,375,911 36,218,609 (121,471,511) 232,440,556
Investment income 1,163,400
Gain on disposal of
investments
6,146,382
Total income 239,750,338
Area profit (loss) before
income taxes
(42,095)
(212,075)
4,065,360
(362,419)
208,045 3,656,816
Net investment income 147,402
Gain on disposal of
investments, net
5,432,389
Interest expense (596,007)
Consolidated income
before income taxes
8,640,600
Area identifiable assets 74,871,985 3,728,291 36,643,147 14,039,482 (21,238,222) 108,044,683
Long-term investments 15,869,274
Goodwill 547,332
Total assets 124,461,289
Depreciation and
amortization
1,277,725
41,341
227,708
195,623
(440)
1,741,957
Capital expenditures 158,867 8,762 171,491 133,614 - 472,734