Acer 2005 Annual Report Download - page 37
Download and view the complete annual report
Please find page 37 of the 2005 Acer annual report below. You can navigate through the pages in the report by either clicking on the pages listed below, or by using the keyword search tool below to find specific information within the annual report.-
 1
1 -
2
-
3
-
4
-
5
-
6
-
7
-
8
-
9
-
10
-
11
-
12
-
13
-
14
-
15
-
16
-
17
-
18
-
19
-
20
-
21
-
22
-
23
-
24
-
25
-
26
-
 27
27 -
 28
28 -
 29
29 -
 30
30 -
 31
31 -
 32
32 -
 33
33 -
 34
34 -
 35
35 -
 36
36 -
 37
37 -
 38
38 -
 39
39 -
 40
40 -
 41
41 -
 42
42 -
 43
43 -
 44
44 -
 45
45 -
 46
46 -
 47
47 -
48
-
49
-
50
-
51
-
52
-
53
-
54
-
55
-
56
-
57
-
58
-
59
-
60
-
61
-
62
-
63
-
64
-
65
-
66
-
67
-
68
-
69
-
70
-
71
-
72
-
73
-
74
-
75
-
76
-
77
-
78
-
79
-
80
-
81
-
82
-
83
-
84
-
85
-
86
-
87
-
88
-
89
 |
 |

- 32 -
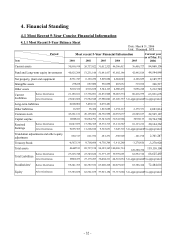
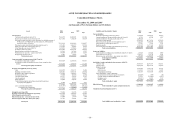
4. Financial Standing
4.1 Most Recent 5-Year Concise Financial Information
4.1.1 Most Recent 5-Year Balance Sheet
Date: March 31, 2006
Unit: Thousand NT$
Period Most recent 5-Year Financial Information
Item 2001 2002 2003 2004 2005
Current
y
ear
as of Mar. 31,
2006
Current assets 30,899,918 26,737,022 31,012,523 46,306,417 76,408,727 84,860,156
Fund and Long-term equity investments 40,925,298 51,231,148 51,681,937 43,692,146 42,445,814 44,544,949
N
et property, plant and equipmen
t
8,531,747 6,163,250 5,809,884 4,664,043 4,108,829 4,185,777
Intangible assets 278228 687,080 536,898 465,632 319,106 306,517
Other assets 5,810,320 4,918,658 5,344,123 4,908,476 5,098,248 5,212,709
Before Distribution 21,185,161 15,756,891 22,872,968 38,067,574 60,416,979 63,931,678
Current
Liabilities After Distribution 23,043,886 19,582,548 27,980,042 43,026,737 Un-appropriated
Un-appropriated
Long-term liabilities 6,000,000 7,494,311 6,678,481 - - -
Other liabilities 18,587 98,424 1,825,688 1,292,117 2,175,331 2,693,814
Common stock 43,261,121 20,195,081 20,736,998 20,933,677 22,545,187 22,545,187
Capital surplus 10608411 36,884,792 33,347,630 30,541,968 30552133 30,764,700
Before Distribution 11,047,053 17,386,385 15,372,713 13,211,567 16,123,212 20,144,362
Retained
Earnings After Distribution 9,095,305 11,206,010 9,325,631 7,645,710 Un-appropriated
Un-appropriated
Translation adjustments and other equity
adjustment 892,317 621,972 281,271 -598,909 -161,198 2,301,287
Treasury Stock -6,567,139 -8,700,698 -6,730,384 -3,411,280 -3,270,920 -3,270,920
Total assets 86445511 89,737,158 94,385,365 100,036,714
128,380,724 139,110,108
Before Distribution 27,203,748 23,349,626 31,377,137 39,359,691 62,592,310 66,625,492
Total Liabilities
After Distribution 29062473 27,175,283 36,484,211 44,318,854 Un-appropriated
Un-appropriated
Stockholders’ Before Distribution 59,241,763 66,387,532 63,008,228 60,677,023 65,788,414 72,484,616
Equity After Distribution 57,383,038 62,561,875 57,901,154 55,717,860 Un-appropriated
Un-appropriated