Acer 2005 Annual Report Download - page 58
Download and view the complete annual report
Please find page 58 of the 2005 Acer annual report below. You can navigate through the pages in the report by either clicking on the pages listed below, or by using the keyword search tool below to find specific information within the annual report.-
 1
1 -
2
-
3
-
4
-
5
-
6
-
7
-
8
-
9
-
10
-
11
-
12
-
13
-
14
-
15
-
16
-
17
-
18
-
19
-
20
-
21
-
22
-
23
-
24
-
25
-
26
-
27
-
28
-
29
-
30
-
31
-
32
-
33
-
34
-
35
-
36
-
37
-
38
-
39
-
40
-
41
-
42
-
43
-
44
-
45
-
46
-
47
-
 48
48 -
 49
49 -
 50
50 -
 51
51 -
 52
52 -
 53
53 -
 54
54 -
 55
55 -
 56
56 -
 57
57 -
 58
58 -
 59
59 -
 60
60 -
 61
61 -
 62
62 -
 63
63 -
 64
64 -
 65
65 -
 66
66 -
 67
67 -
 68
68 -
69
-
70
-
71
-
72
-
73
-
74
-
75
-
76
-
77
-
78
-
79
-
80
-
81
-
82
-
83
-
84
-
85
-
86
-
87
-
88
-
89
 |
 |

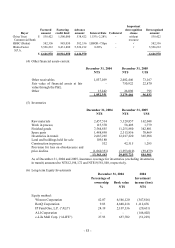
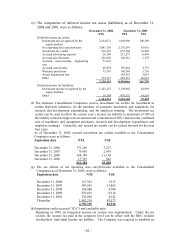
- 53 -
Buyer
Factored
amount
Factoring
credit limit
Advance
amount
Interest Rate
Collateral
Important
derecognition
clause
Derecognized
amount
China Trust
Commercial Bank
$ 538,422 1,500,000 538,422 1.53%~2.28% - without
recourse
538,422
HSBC (Dubai) 582,336 985,050 582,336 LIBOR+75bps - 〃 582,336
Ifitalia Factor
S.P.A.
5,526,212
8,431,800
5,526,212
0.20% - 〃 5,526,212
$ 6,646,970 10,916,850 6,646,970 6,646,970
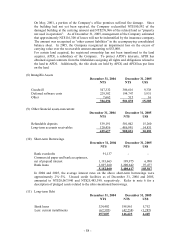
(4) Other financial assets-current
December 31, 2004 December 31, 2005
NT$ NT$ US$
Other receivables 1,837,109 2,402,446 73,167
Fair value of financial assets at fair
value through the P&L
- 750,922 22,870
Other 15,242 26,098 795
1,852,351 3,179,466 96,832
(5) Inventories
December 31, 2004 December 31, 2005
NT$ NT$ US$
Raw materials 2,457,514 5,320,857 162,048
Work in process 115,570 58,405 1,779
Finished goods 7,564,855 11,255,880 342,801
Spare parts 1,488,898 2,313,856 70,469
Inventories in transit 2,687,265 12,017,220 365,988
Land and buildings held for sale 109,180 - -
Construction in process 532 42,515 1,295
Provision for loss on obsolescence and
price decline
(1,060,351)
(1,953,010)
(59,479)
13,363,463 29,055,723 884,901
As of December 31, 2004 and 2005, insurance coverage for inventories (excluding inventories
in transit) amounted to NT$12,194,172 and NT$19,581,540, respectively.
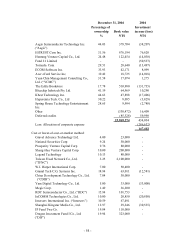
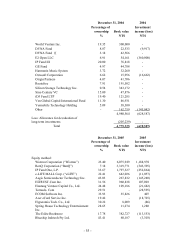
(6) Long-term Equity Investments
December 31, 2004 2004
Percentage of
ownership
Book value
Investment
income (loss)
% NT$ NT$
Equity method:
Wistron Corporation 42.07 6,546,120 (347,816)
BenQ Corporation 9.83 4,848,218 1,112,676
IP Fund One, L.P. (“ALI”) 24.19 2,107,336 (20,631)
ALI Corporation - - (146,402)
e-Life Mall Corp. (“eLIFE”) 27.93 657,702 (51,229)