Acer 2005 Annual Report Download - page 35
Download and view the complete annual report
Please find page 35 of the 2005 Acer annual report below. You can navigate through the pages in the report by either clicking on the pages listed below, or by using the keyword search tool below to find specific information within the annual report.-
 1
1 -
2
-
3
-
4
-
5
-
6
-
7
-
8
-
9
-
10
-
11
-
12
-
13
-
14
-
15
-
16
-
17
-
18
-
19
-
20
-
21
-
22
-
23
-
24
-
 25
25 -
 26
26 -
 27
27 -
 28
28 -
 29
29 -
 30
30 -
 31
31 -
 32
32 -
 33
33 -
 34
34 -
 35
35 -
 36
36 -
 37
37 -
 38
38 -
 39
39 -
 40
40 -
 41
41 -
 42
42 -
 43
43 -
 44
44 -
 45
45 -
46
-
47
-
48
-
49
-
50
-
51
-
52
-
53
-
54
-
55
-
56
-
57
-
58
-
59
-
60
-
61
-
62
-
63
-
64
-
65
-
66
-
67
-
68
-
69
-
70
-
71
-
72
-
73
-
74
-
75
-
76
-
77
-
78
-
79
-
80
-
81
-
82
-
83
-
84
-
85
-
86
-
87
-
88
-
89
 |
 |
- 30 -
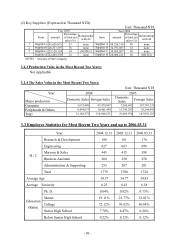
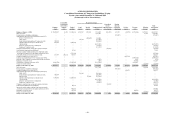
(2) Key Suppliers (Expressed in Thousand NTD).
Unit: Thousand NT$
Year 2003 Year 2004
From amount
Percentage
of total net
sales (%)
Relationship
with AI from amount
Percentage
of total net
sales (%)
Relationship
with AI
1 Supplier a
41,628,921 23 none
Supplier A 88,356,319 30 none
2 Supplier b
28,517,597 16 none
Supplier B 34,793,087 12 none
3 Supplier c
25,128,324 14 (NOTE1) Supplier C 30,055,207 10 none
Supplier d
22,209,570 12 none
Supplier D 28,080,221 10 (NOTE1)
NOTE1:Investee of the Company
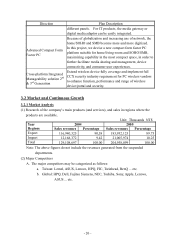
3.2.3 Production Value in the Most Recent Two Years:
Not Applicable
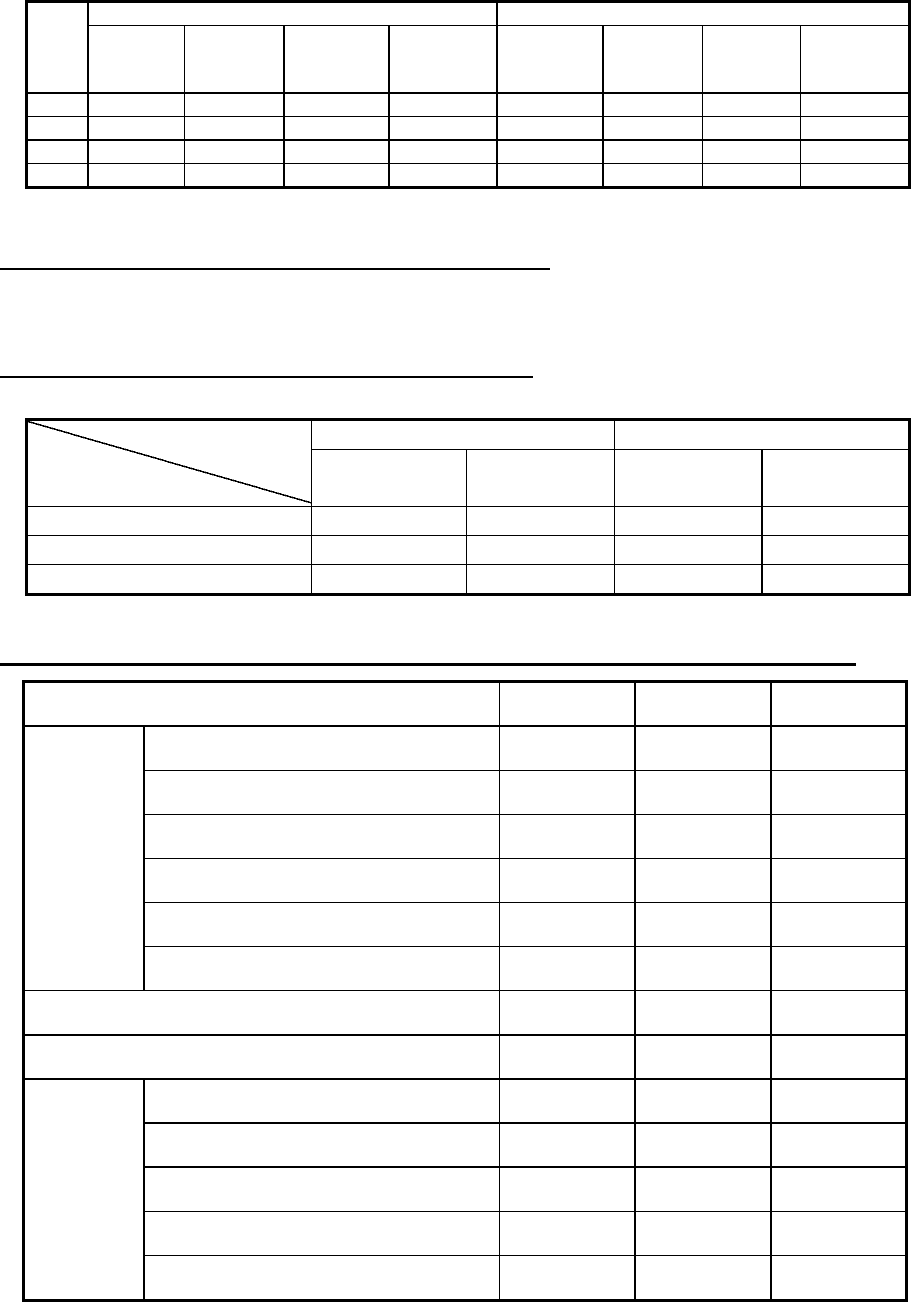
3.2.4 The Sales Value in the Most Recent Two Years:
Unit: Thousand NT$
2004 2005 Year
Major production Domestic Sales Foreign Sales Domestic
Sales Foreign Sales
Computer 3,673,499 97,478,867 7,260,682 147,747,132
Peripherals & Others 8,494,873 19,461,458 13,745,292 36,204,993
Total 12,168,372 116,940,325 21,005,974 183,952,125
3.3 Employee Statistics for Most Recent Two Years and up to 2006.03.31
Year 2004.12.31 2005.12.31 2006.03.31
Research & Development 188 161 176
Engineering 627 667 699
Marcom & Sales 445 415 398
Business Assistant 266 250 250
Administration & Supporting 253 207 201
H / C
Total 1779 1700 1724
Average Age 34.57 34.77 34.83
Average Seniority 6.25 6.41 6.38
Ph. D. 0.84% 0.82% 0.75%
Master 19.11% 21.77% 23.03%
College 72.12% 70.82% 69.84%
Senior High School 7.70% 6.47% 6.26%
Education
(Ratio)
Below Senior High School 0.22% 0.12% 0.12%