Acer 2005 Annual Report Download - page 71
Download and view the complete annual report
Please find page 71 of the 2005 Acer annual report below. You can navigate through the pages in the report by either clicking on the pages listed below, or by using the keyword search tool below to find specific information within the annual report.-
 1
1 -
2
-
3
-
4
-
5
-
6
-
7
-
8
-
9
-
10
-
11
-
12
-
13
-
14
-
15
-
16
-
17
-
18
-
19
-
20
-
21
-
22
-
23
-
24
-
25
-
26
-
27
-
28
-
29
-
30
-
31
-
32
-
33
-
34
-
35
-
36
-
37
-
38
-
39
-
40
-
41
-
42
-
43
-
44
-
45
-
46
-
47
-
48
-
49
-
50
-
51
-
52
-
53
-
54
-
55
-
56
-
57
-
58
-
59
-
60
-
 61
61 -
 62
62 -
 63
63 -
 64
64 -
 65
65 -
 66
66 -
 67
67 -
 68
68 -
 69
69 -
 70
70 -
 71
71 -
 72
72 -
 73
73 -
 74
74 -
 75
75 -
 76
76 -
 77
77 -
 78
78 -
 79
79 -
 80
80 -
 81
81 -
82
-
83
-
84
-
85
-
86
-
87
-
88
-
89
 |
 |

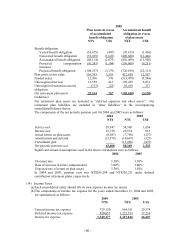
- 66 -
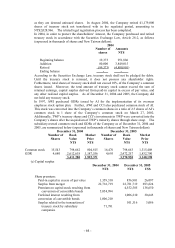
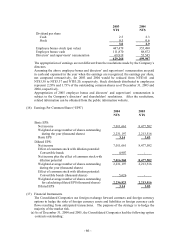
2003 2004
NT$ NT$
Dividend per share
Cash 2.5 2.3
Stock 0.5 0.6
3.0 2.9
Employee bonus-stock (par value) 447,479 355,490
Employee bonus-cash 111,870 88,872
Directors’ and supervisors’ remuneration 69,919 55,545
629,268 499,907
The appropriation of earnings are not different from the resolutions made by the Company’ s
directors.
Assuming the above employee bonus and directors’ and supervisors’ remuneration are paid
in cash and expensed in the year when the earnings are recognized, the earnings per share,
not computed retroactively, for 2003 and 2004 would be reduced from NT$3.61 and
NT$3.38 to NT$3.37 and NT$3.20, respectively. Stock dividends distributed to employees
represent 2.28% and 1.73% of the outstanding common shares as of December 31, 2003 and
2004, respectively.
Appropriation of 2005 employee bonus and directors’ and supervisors’ remuneration is
subject to the Company’ s directors’ and shareholders’ resolutions. After the resolutions,
related information can be obtained from the public information website.
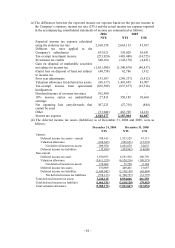
(16) Earnings Per Common Share (“EPS”)
2004 2005
NT$ NT$
Basic EPS:
Net income 7,011,661 8,477,502
Weighted-average number of shares outstanding
during the year (thousand shares)
2,231,197
2,213,516
Basic EPS 3.14 3.83
Diluted EPS:
Net income 7,011,661 8,477,502
Effect of common stock with dilution potential:
Convertible bonds 4,907 -
Net income plus the effect of common stock with
dilution potential
7,016,568
8,477,502
Weighted-average number of shares outstanding
during the year (thousand shares)
2,231,197 2,213,516
Effect of common stock with dilution potential:
Convertible bonds (thousand shares) 5,626 -
Weighted-average number of shares outstanding
for calculating diluted EPS (thousand shares)
2,236,823
2,213,516
Diluted EPS 3.14 3.83
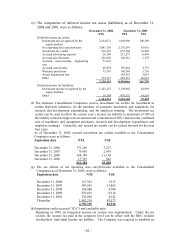
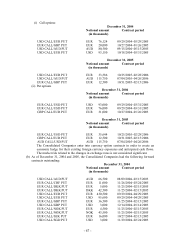
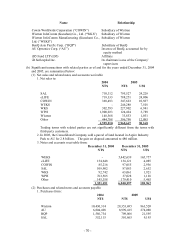
(17) Financial Instruments
The Consolidated Companies use foreign exchange forward contracts and foreign currency
options to hedge the risks of foreign currency assets and liabilities or foreign currency cash
flows resulting from anticipated transactions. The purpose of the strategy is to hedge the
majority of the market risk.
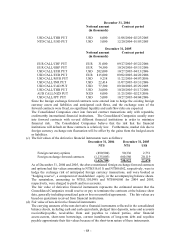
(a) As of December 31, 2004 and 2005, the Consolidated Companies had the following option
contracts outstanding: