Acer 2005 Annual Report Download - page 79
Download and view the complete annual report
Please find page 79 of the 2005 Acer annual report below. You can navigate through the pages in the report by either clicking on the pages listed below, or by using the keyword search tool below to find specific information within the annual report.-
 1
1 -
2
-
3
-
4
-
5
-
6
-
7
-
8
-
9
-
10
-
11
-
12
-
13
-
14
-
15
-
16
-
17
-
18
-
19
-
20
-
21
-
22
-
23
-
24
-
25
-
26
-
27
-
28
-
29
-
30
-
31
-
32
-
33
-
34
-
35
-
36
-
37
-
38
-
39
-
40
-
41
-
42
-
43
-
44
-
45
-
46
-
47
-
48
-
49
-
50
-
51
-
52
-
53
-
54
-
55
-
56
-
57
-
58
-
59
-
60
-
61
-
62
-
63
-
64
-
65
-
66
-
67
-
68
-
 69
69 -
 70
70 -
 71
71 -
 72
72 -
 73
73 -
 74
74 -
 75
75 -
 76
76 -
 77
77 -
 78
78 -
 79
79 -
 80
80 -
 81
81 -
 82
82 -
 83
83 -
 84
84 -
 85
85 -
 86
86 -
 87
87 -
 88
88 -
 89
89
 |
 |

- 74 -
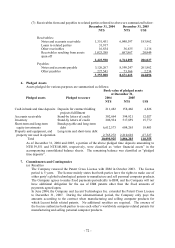
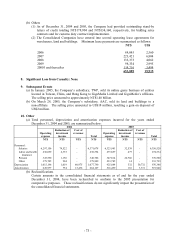
11. Segment Information
(a) Industry segment
Industry segment data as of and for the years ended December 31, 2004 and 2005, is
summarized below:
2004
Information
technology
products
Distribution
channels
Property
development
Other
Eliminations
Consolidated
NT$ NT$ NT$ NT$ NT$ NT$
Segment income:
Customers 203,054,996 26,504,426 328,977 2,552,157 - 232,440,556
Inter-company 823,586 485,447 35,786 6,546 (1,351,365) -
203,878,582 26,989,873 364,763 2,558,703 (1,351,365) 232,440,556
Investment income 1,163,400
Gain on disposal of investments 6,146,382
Total income 239,750,338
Segment profit (loss) before
income taxes
3,969,241
321,922
(54,404)
(563,889)
(16,054) 3,656,816
Net investment income 147,402
Gain on disposal of
investments, net
5,432,389
Interest expense (596,007)
Consolidated income before
income taxes
8,640,600
Segment identifiable assets 88,994,358 7,820,680 4,071,759 7,501,296 (343,410) 108,044,683
Long-term investments 15,869,274
Goodwill 547,332
Total assets 124,461,289
Depreciation and amortization 1,167,009 201,365 3,274 370,309 - 1,741,957
Capital expenditures 437,647 22,523 989 11,575 - 472,734
2005
Information
technology
products
Distribution
channels
Property
development
Other
Eliminations
Consolidated
NT$ NT$ NT$ NT$ NT$ NT$
Segment income:
Customers 294,294,290 29,176,746 2,973,019 2,291,644 - 328,735,699
Inter-company 1,385,951 840,864 37,977 11,160 (2,275,952) -
295,680,241 30,017,610 3,010,996 2,302,804 (2,275,952) 328,735,699
Investment income 1,373,113
Gain on disposal of investments 5,716,103
Total income 335,824,915
Segment profit (loss) before
income taxes
6,530,854
482,551
469,543
(1,165,683)
(871,970) 5,445,295
Net investment income (42,179)
Gain on disposal of
investments, net
5,634,709
Interest expense (385,293)
Consolidated income before
income taxes
10,652,532
Segment identifiable assets 144,344,164 8,608,182 946,635 4,736,056 (679,190) 157,955,847
Long-term investments 13,299,186
Goodwill 306,616
Total assets 171,561,649
Depreciation and amortization 1,103,103 79,371 2,094 311,726 - 1,496,294
Capital expenditures 478,946 18,154 - 8,297 - 505,397