Acer 2005 Annual Report Download - page 6
Download and view the complete annual report
Please find page 6 of the 2005 Acer annual report below. You can navigate through the pages in the report by either clicking on the pages listed below, or by using the keyword search tool below to find specific information within the annual report.-
 1
1 -
 2
2 -
 3
3 -
 4
4 -
 5
5 -
 6
6 -
 7
7 -
 8
8 -
 9
9 -
 10
10 -
 11
11 -
 12
12 -
 13
13 -
 14
14 -
 15
15 -
 16
16 -
 17
17 -
18
-
19
-
20
-
21
-
22
-
23
-
24
-
25
-
26
-
27
-
28
-
29
-
30
-
31
-
32
-
33
-
34
-
35
-
36
-
37
-
38
-
39
-
40
-
41
-
42
-
43
-
44
-
45
-
46
-
47
-
48
-
49
-
50
-
51
-
52
-
53
-
54
-
55
-
56
-
57
-
58
-
59
-
60
-
61
-
62
-
63
-
64
-
65
-
66
-
67
-
68
-
69
-
70
-
71
-
72
-
73
-
74
-
75
-
76
-
77
-
78
-
79
-
80
-
81
-
82
-
83
-
84
-
85
-
86
-
87
-
88
-
89
 |
 |

- 1 -
1. Business Report
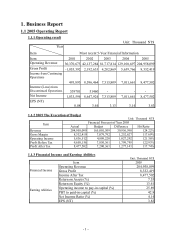
1.1 2005 Operating Report
1.1.1 Operating result
Unit: Thousand NT$
Year
Item Most recent 5-Year Financial Information
Item 2001 2002 2003 2004 2005
Operating Revenue 30,370,675 42,137,284 81,717,814 129,108,697 204,958,099
Gross Profit -1,055,392 2,192,633 4,282,869 5,659,766 8,332,419
Income from Continuing
Operations
493,893 8,596,464 7,313,809 7,011,661 8,477,502
Income (Loss) from
Discontinued Operations 539701 51460 - - -
Net Income 1,033,594 8,647,924 7,313,809 7,011,661 8,477,502
EPS (NT)
0.08 3.44 3.13 3.14 3.83
1.1.2 2005 The Execution of Budget
Unit: Thousand NT$
Financial Forecast of Year 2005
Item Actual Budget Difference Hit Ratio
Revenue 204,958,099 165,001,509 39,956,590 124.22%
Gross Margin 8,332,419 7,079,792 1,252,627 117.69%
Operating Income 5,836,512 4,809,220 1,027,292 121.36%
Profit Before Tax 9,650,156 7,850,361 1,799,795 122.93%
Profit After Tax 8,477,502 7,200,361 1,277,141 117.74%
1.1.3 Financial Income and Earning Abilities
Unit: Thousand NT$
Item 2005
Operating Revenue 204,958,099
Gross Profit 8,332,419
Financial Income
Income After Tax 8,477,502
Return on Assets (%) 7.55
Return on Equity (%) 13.41
Operating income to pay-in capital (%) 25.89
PBT to paid-in capital (%) 42.8
Net Income Ratio (%) 4.14
Earning Abilities
EPS (NT) 3.83